A credible construction cost estimate is required prior to engaging in procurement. The follow elements are common to a credible construction cost estimate.
Credible Cost Estimate Core Elements
#1 Objectivity – The information used and those invovled in the creation of the construction cost estimate must be objective. Primary data sources should be used whenever possible. Secondary data sources, such as contractor and subcontractor quotes are secondary data sources and should not be exclusively relied upon.
#2 Timeliness – All cost data must be current. The reliance on outdated information (more the three month old) can introduce significant error. The use of economic factors (i.e. ENR economic index, etc.) applied to a outdated cost estimate will introduce significant error.
3# Local Market – All cost data must be based upon local market conditions. Locally researched labor, material, equipment, and productivity data is essential in the devlopement of a credible construction cost estimate. The use of national average cost data with or without area location factoring (City Cost Index, CCI, Area Cost Factor, ACF…) will introduce significant error.

To meet their responsibilities as stakeholders of the built environment ( facilities and other built structures ), public sector owners need to have the ability create credible construction cost estimate for ALL repair, renovation, maintenance (FSRM), and new build projects.
Education, key performance indicators, common terms and definitions, collaborative construction delivery methods, and current, objective, local market granular cost data as well as supporting technology can to be leveraged to enable significant cost savings via signifincant improvements in cost visibility, cost management, and productivity.
Federal, State, County, and Local Government, as well as Education, Healthcare and Transportation Departments and Agencies have a responsibility to create cost visibility and cost transparency and drive improved construction productivity. However, multiple studies/reports note that available and proven best management practices have not been implemented on a widespread basis.
For example, GAO and other studies/reports consistently report that errors and lack of due diligence with respect to original construction cost estimates are primary reasons for negative cost and schedule impacts, and overall poor project performance and outcomes. T
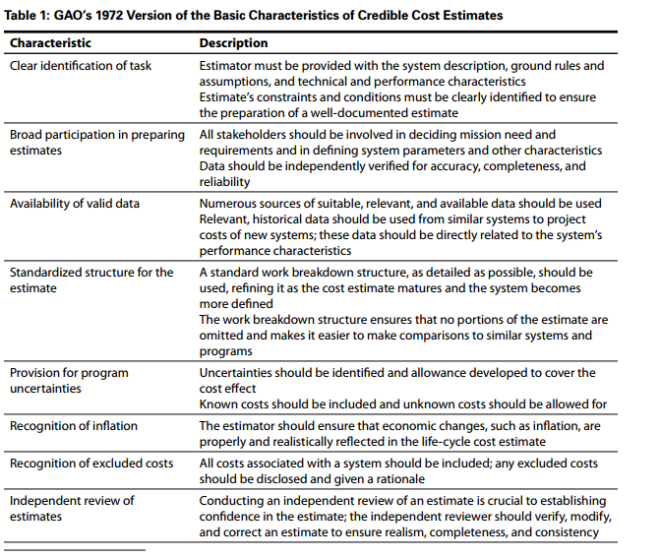
The following figure, for example, was produced in 1972.
“Despite the fact that these basic characteristics have been published and known for decades, we find that many agencies still lack the ability to develop cost estimates that can satisfy them”. – GAO, 2009
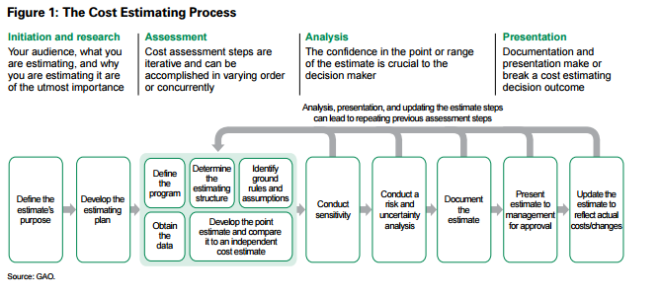
The associated processes for developing a credible construction cost estimate are equally well documented.
From a more detailed perspective, the following steps have been published as a path toward a quality cost estimate.
- Define estimate’s purpose ■ Determine estimate’s purpose, required level of detail, and overall scope; ■ Determine who will receive the estimate
- Develop estimating plan ■ Determine the cost estimating team and develop its master schedule; ■ Determine who will do the independent cost estimate; ■ Outline the cost estimating approach; ■ Develop the estimate timeline
- Define program characteristics ■ In a technical baseline description document, identify the program’s purpose and its system and performance characteristics and all system configurations; ■ Any technology implications; ■ Its program acquisition schedule and acquisition strategy; ■ Its relationship to other existing systems, including predecessor or similar legacy systems; ■ Support (manpower, training, etc.) and security needs and risk items; ■ System quantities for development, test, and production; ■ Deployment and maintenance plans
- Determine estimating structure ■ Define a work breakdown structure (WBS) and describe each element in a WBS dictionary (a major automated information system may have only a cost element structure); ■ Choose the best estimating method for each WBS element; ■ Identify potential cross-checks for likely cost and schedule drivers; ■ Develop a cost estimating checklist
- Identify ground rules and assumptions ■ Clearly define what the estimate includes and excludes; ■ Identify global and program-specific assumptions, such as the estimate’s base year, including time-phasing and life cycle; ■ Identify program schedule information by phase and program acquisition strategy; ■ Identify any schedule or budget constraints, inflation assumptions, and travel costs; ■ Specify equipment the government is to furnish as well as the use of existing facilities or new modification or development; ■ Identify prime contractor and major subcontractors; ■ Determine technology refresh cycles, technology assumptions, and new technology to be developed; ■ Define commonality with legacy systems and assumed heritage savings; ■ Describe effects of new ways of doing business
- Obtain data ■ Create a data collection plan with emphasis on collecting current and relevant technical, programmatic, cost, and risk data; ■ Investigate possible data sources; ■ Collect data and normalize them for cost accounting, inflation, learning, and quantity adjustments; ■ Analyze the data for cost drivers, trends, and outliers and compare results against rules of thumb and standard factors derived from historical data; ■ Interview data sources and document all pertinent information, including an assessment of data reliability and accuracy; ■ Store data for future estimates/
- Develop point estimate and compare it to an independent cost estimate ■ Develop the cost model, estimating each WBS element, using the best methodology from the data collected,a and including all estimating assumptions; ■ Express costs in constant year dollars; ■ Time-phase the results by spreading costs in the years they are expected to occur, based on the program schedule; ■ Sum the WBS elements to develop the overall point estimate; ■ Validate the estimate by looking for errors like double counting and omitted costs; ■ Compare estimate against the independent cost estimate and examine where and why there are differences; ■ Perform cross-checks on cost drivers to see if results are similar; ■ Update the model as more data become available or as changes occur and compare results against previous estimates
- Conduct sensitivity analysis ■ Test the sensitivity of cost elements to changes in estimating input values and key assumptions; ■ Identify effects on the overall estimate of changing the program schedule or quantities; ■ Determine which assumptions are key cost drivers and which cost elements are affected most by changes
- Conduct risk and uncertainty analysis ■ Determine and discuss with technical experts the level of cost, schedule, and technical risk associated with each WBS element; ■ Analyze each risk for its severity and probability; ■ Develop minimum, most likely, and maximum ranges for each risk element; ■ Determine type of risk distributions and reason for their use; ■ Ensure that risks are correlated; ■ Use an acceptable statistical analysis method (e.g., Monte Carlo simulation) to develop a confidence interval around the point estimate; ■ Identify the confidence level of the point estimate; ■ Identify the amount of contingency funding and add this to the point estimate to determine the risk-adjusted cost estimate; ■ Recommend that the project or program office develop a risk management plan to track and mitigate risks 14 GAO-09-3SP Chapter 1 11 Step Description Associated task Chapter
- Document the estimate ■ Document all steps used to develop the estimate so that a cost analyst unfamiliar with the program can recreate it quickly and produce the same result; ■ Document the purpose of the estimate, the team that prepared it, and who approved the estimate and on what date; ■ Describe the program, its schedule, and the technical baseline used to create the estimate; ■ Present the program’s time-phased life-cycle cost; ■ Discuss all ground rules and assumptions; ■ Include auditable and traceable data sources for each cost element and document for all data sources how the data were normalized; ■ Describe in detail the estimating methodology and rationale used to derive each WBS element’s cost (prefer more detail over less); ■ Describe the results of the risk, uncertainty, and sensitivity analyses and whether any contingency funds were identified; ■ Document how the estimate compares to the funding profile; ■ Track how this estimate compares to any previous estimates
- Present estimate to management for approval ■ Develop a briefing that presents the documented life-cycle cost estimate; ■ Include an explanation of the technical and programmatic baseline and any uncertainties; ■ Compare the estimate to an independent cost estimate (ICE) and explain any differences; ■ Compare the estimate (life-cycle cost estimate (LCCE)) or independent cost estimate to the budget with enough detail to easily defend it by showing how it is accurate, complete, and high in quality; ■ Focus in a logical manner on the largest cost elements and cost drivers; ■ Make the content clear and complete so that those who are unfamiliar with it can easily comprehend the competence that underlies the estimate results; ■ Make backup slides available for more probing questions; ■ Act on and document feedback from management; ■ Request acceptance of the estimate
- Update the estimate to reflect actual costs and changes ■ Update the estimate to reflect changes in technical or program assumptions or keep it current as the program passes through new phases or milestones; ■ Replace estimates with EVM EAC and independent estimate at completion (EAC) from the integrated EVM system; ■ Report progress on meeting cost and schedule estimates; ■ Perform a post mortem and document lessons learned for elements whose actual costs or schedules differ from the est imate; ■ Document all changes to the program and how they affect the cost estimate – Source: GAO, DHS, DOD, DOE, NASA, SCEA, and industry.
Without accurate, timely, consistent, and actionable information, improved decision-marking and the associated reduction of rampant construction waste is impossible.
All public sector entities would benefit by using locally researched standardized cost data to generate line item cost estimates for construction projects. This practice would not only provide requisite transparency, but also improve early, ongoing, and higher quality project work scope. Sharing actionable, transparent information with all construction project participants and stakeholders early on, and throughout the construction and operations life-cycle of a built structure, would measurably mitigate change orders, legal disputes, and waste.
Typical construction project stake holders include: Owners (management, engineering, contracting/procurement, building users), Contractors, Subcontractors, and Designers/Architects.
Standardized Cost Data
“Many standard project construction breakdown structures have been created over the years for use in construction management. The most common, in existence since the 1960s, are the CSI (Construction Specifications Institute) format in North America and the SMM7 (Standard Method of Measurement) format in Great Britain.11 They originated as breakdowns for commercial building construction but have evolved to include other forms of construction.
CSI introduced an expanded version, the MasterFormat™, in 2004 that includes 50 divisions of work covering civil site and infrastructure work as well as process equipment—a significant increase from the previous 16 divisions covering building construction that had been in use for years. This expansion reflects the growing complexity of the construction industry, as well as the need to incorporate facility life cycle. and maintenance information into the building knowledge base. Another level of standardized numbers was added to the publication. One goal was to eventually facilitate building information modeling to contain project specifications. The MasterFormat™ standard serves as the organizational structure for construction industry publications such as the Sweets catalog, with a wide range of building products; MasterSpec and other popular master guide specification applications, and RS Means and other cost information applications.
MasterFormat helps architects, engineers, owners, contractors, and manufacturers classify the typical use of various products to achieve technical solutions on the job site, known as “work results.” Work results are permanent or temporary aspects of construction projects achieved in the production stage or by subsequent alteration, maintenance, or demolition processes, through the application of a particular skill or trade to construction resources.
The OmniClass™ Construction Classification System, a new North American classification system, is useful for many additional applications, from organizing library materials, product literature, and project information to providing a classification structure for electronic databases. It incorporates other systems in use as the basis of many of its tables, including MasterFormat for work results and UniFormat™ for elements.
OmniClass follows the international framework set out in International Organization for Standardization
(ISO) Technical Report 14177—Classification of Information in the Construction Industry, This document has been established as a standard in ISO 12006-2: Organization of Information about Construction Works—Part 2: Framework for Classification of Information.
It is also worth noting that CSI is involved in developing a corresponding system for terminology based on a related ISO standard, ISO 12006-3: Organization of Information about Construction Works—Part 3: Framework for Object-Oriented Information. The system known as the International Framework for Dictionaries (IFD) Library is a standard for terminology libraries or ontologies. It is part of the international standards for building information modeling being developed and promoted by buildingSMART International (bSI). CSI sees the IFD Library being used in conjunction with OmniClass to establish a controlled vocabulary for the North American building industry, thereby improving interoperability. Both OmniClass and the IFD Library are included in the development work of the buildingSmart alliance (the North American chapter of bSI) and its National Building Information Modeling Standard (NBIMS).
OmniClass consists of 15 tables, each representing a different facet of construction information. Each table can be used independently to classify a particular type of information, or entries on it can be combined with entries on other tables to classify more complex subjects. The tables are not numbered sequentially and there are gaps in the progression. The first is table 11, Construction Entities by Function, and the last
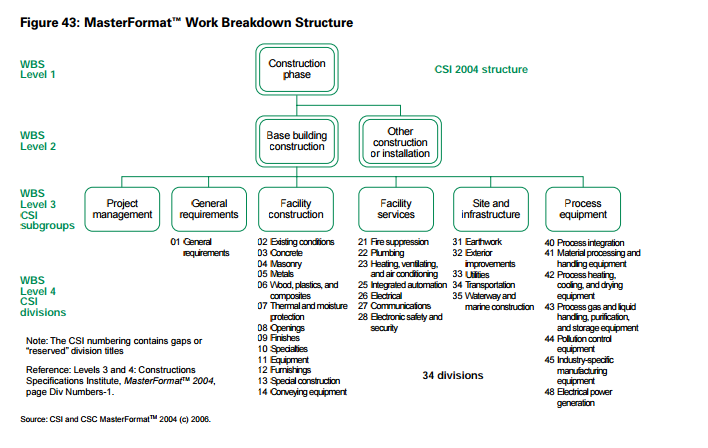
of the 15 is table 49, Properties. The OmniClass structures start to approach the DOD WBS template model at the system level regarding construction classifications. In its table 21 under “Utilities and Infrastructure” is included breakdowns for roadways, railways, airports, space travel, utilities, and water-related construction. This is not unlike a concept in aircraft systems, electronic systems, missile systems, and ship systems from the DOD Mil Handbook template. OmniClass table 22 is based almost entirely on the CSI MasterFormat tables, although it is noted in OmniClass that “some content of MasterFormat 2004 Edition is not included in table 22.” None of the current construction breakdowns, including CSI, fully cover the complete civil infrastructure project life cycle, including development, engineering, construction, operations, maintenance, and risk mitigation. The current CSI MasterFormat 2004 edition comes closest to covering all the scope of work found in the construction of building facilities and site work. It falls short in addressing the unique requirements of program managers, estimators, schedulers, and cost engineers and in identifying all phases of work included in major infrastructure work such as Build Own and Transfer programs. These structures, MasterFormat, and OmniClass are not program work breakdown structures, although some subsections have the appearance of a WBS. However, at all levels the elements in the structures are candidates for WBS element descriptors, including work packages, and they meet the common definitions of WBS elements, being all nouns or nouns and adjectives. The MasterFormat tables include the equivalent of a WBS dictionary for the lowest levels. Many listings available in MasterFormat would enable an organization to pick and choose to provide ready-to-go WBS elements for virtually any work on any construction project, including related equipment and furnishings. It must be noted, however, that the summary headings are not truly WBS elements, since the breakdown or listings under the headings are further listings of categories within a heading and do not meet the WBS 100 percent rule. Figure 43 illustrates the relationship of the CSI MasterFormat structure to a WBS based on the CSI structure. (A true WBS would be based on the actual product structure.) The summary CSI elements are listed as the 34 divisions. Each division contains one or more sections that would be selected from the complete MasterFormat set to relate to the specific needs of the project. Also, although not shown, the specific physical breakdown of the building needs to be overlaid. For example, it would be normal for the individual floors to be identified and the appropriate work packages for each floor selected from the appropriate MasterFormat sections. Note, also, that there is no further breakdown of the project management element as would be the case in a true WBS. ” – GAO Report, 2009
via www.4bt.us – Data, tools, and services to support efficient planning, procrement, and delivery of physical infrastructure.


