Job Order Contracting versus Design Bid Build

Job Order Contracting versus Design Bid Build can help to measurably improve construction productivity, quality, delivery times, and overall satisfaction for all participants.

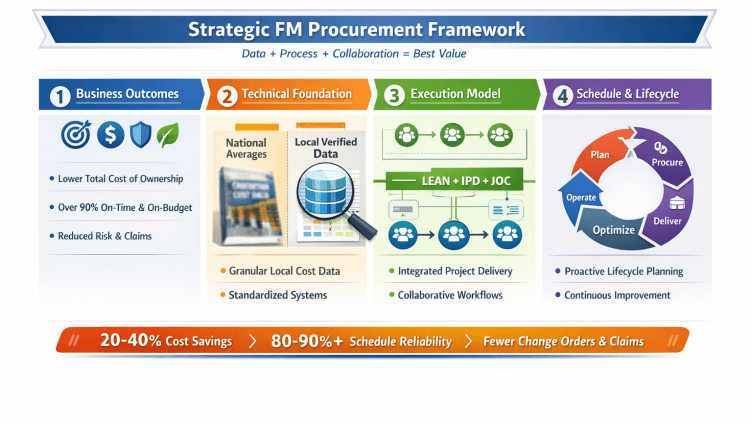
Job order contracting saves significant time and improves quality, consistency, and overall satisfaction vs. traditional design-bid-build.

Efficiently managing the numerous renovation, repair, maintenance, sustainability, and minor new construction projects facing real property owners and facilities management teams is critical to the success of every facilities dependent organization.

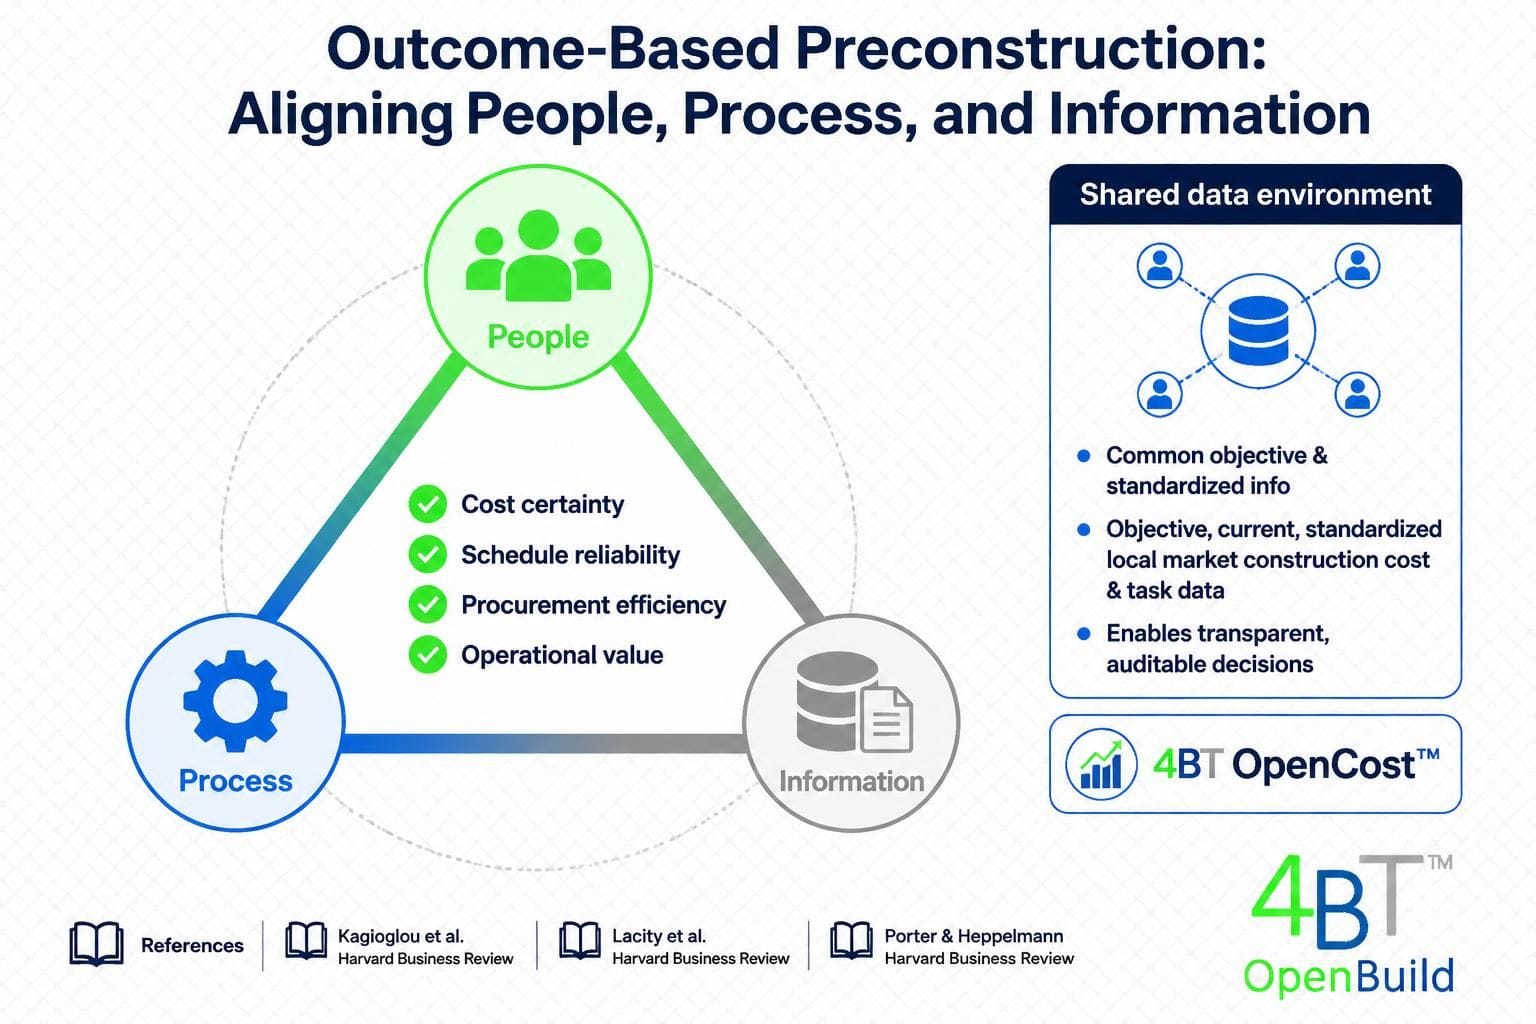
Job order contracting is a LEAN collaborative construction procurement and delivery method that that delivers major advantages versus conventional design-bid-build.   The focus placed upon early upfront and ongoing communications and full transparency associated  with Job Order Contracting  is central to improving outcomes.

Even though job order contracting has been successfully practiced in the U.S. since the 1980’s, it remains unknown to many and is commonly poorly implemented.

Job Order Contracting requires competency and leadership on the part of the owner, and an appropriate focus upon change management.    Collaboration, mutual respect and trust among selected service providers and the owner,  and full financial transparency are targeted goals.

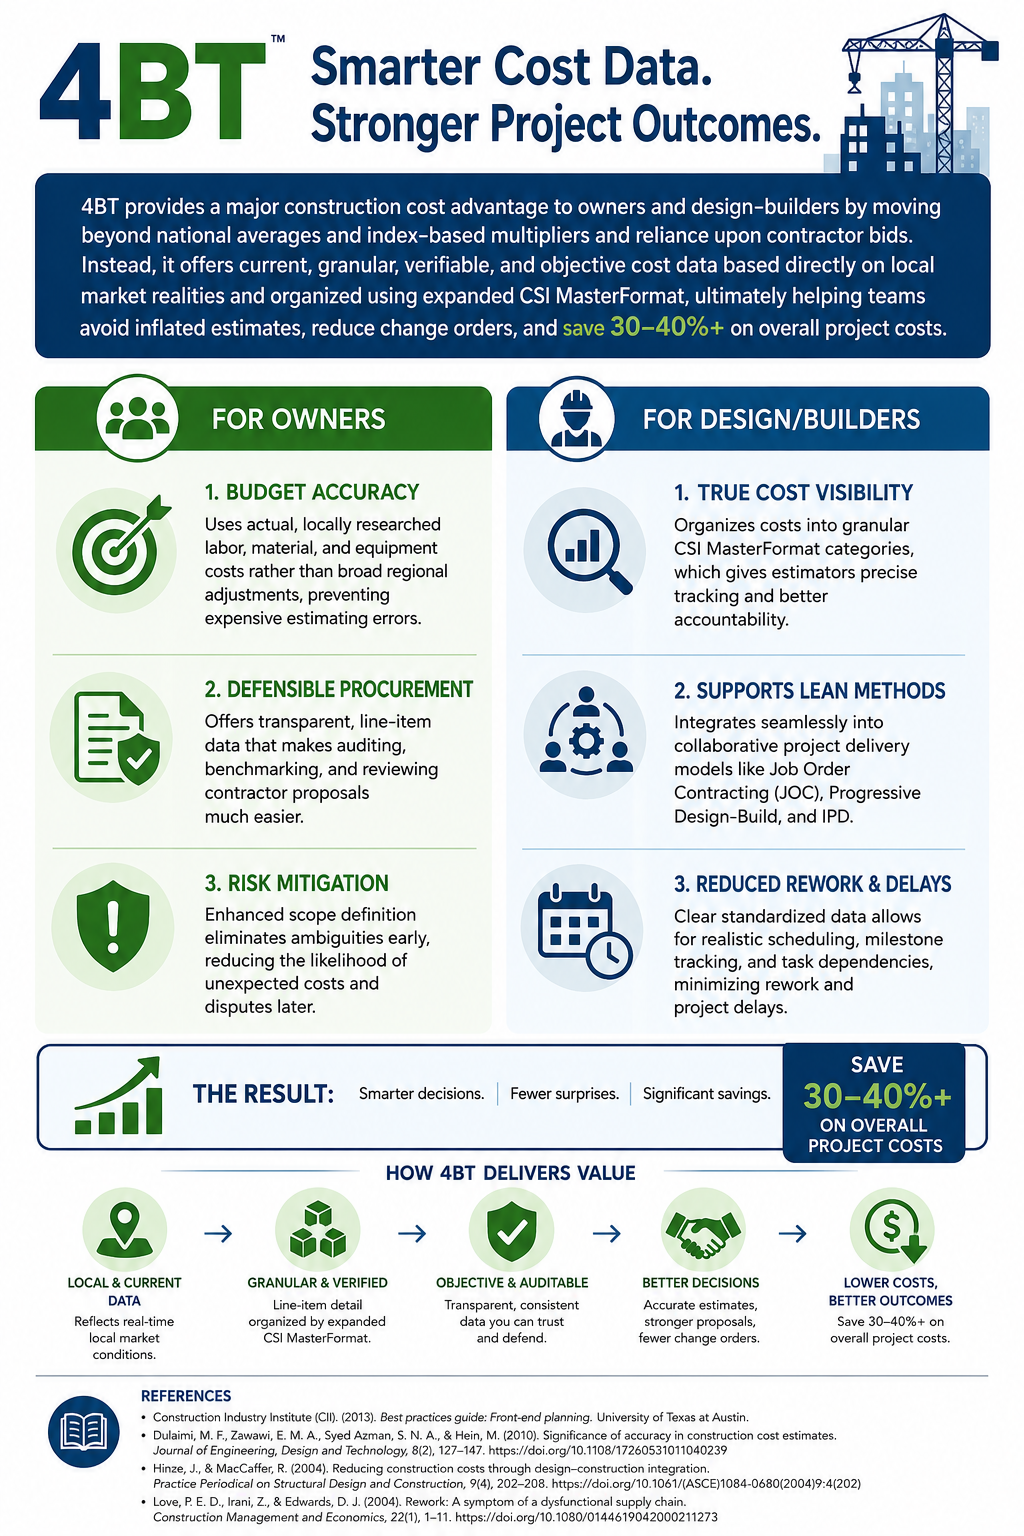
A locally researched, independently sourced detailed line item Unit Price Book, UPB, provides the basis for shared project knowledge and transparent pricing.   A properly designed UPB lists common and repetitive commercial construction tasks construction tasks using industry standard terms in plain English.   Each line item includes labor, material, and equipment costs as appropriate.  The UPB generally has approximately 40,000 to 60,000 line items, including demolition line items and line item modifiers.   The latter account for varying quantities, work location, and other variables.    Best management practice notes that the UPB be updated annually and locally researched.

JOC is an  an integrated project delivery (IPD) approach designed specifically for smaller renovation, repair and minor new construction projects, however maintains all the same collaborative principles.

Integrated project delivery ” integrates people, systems, business structures and practices into a process that collaboratively harnesses the talents and insights of all participants to reduce waste and optimize efficiency through all phases of design, fabrication and construction…. Integrated Project Delivery is built on collaboration. As a result, it can only be successful if the participants share and apply common values and goals.” – AIA


Benefits of Job Order Contracting versus Design Bid Build

  • Higher productivity
  • Improved quality and overall satisfaction
  • On-demand services
  • Improved financial visibility
  • Virtual elimination of legal disputes
  • Fewer change orders
  • Fully defined roles, expectations, and deliverables.

Job Order Contracting versus Design Bid Build


Common Myths Associated with Job Order Contracting versus Design Bid Build

  • Higher costs
  • Best to outsource (JOC managed by a JOC consultant versus a JOC Owner)
  • JOC is for everyone
  • JOC can be managed in spreadsheets
  • JOC doesn’t require continuous training
  • Procurement, facility end-users, and technical teams (DPW/facilities management) are not directly involved
  • Owners don’t need to review contractor estimates
  • Owners don’t need to prepare their own internal estimates for some projects.
  • JOC programs don’t need to be audited

Learn more…

← Back

Thank you for your response. ✨


Construction Cost Database Development

How any organization approaches construction cost data development can have a significant impact upon cost visibility and cost management capability. Understanding the intricacies of Construction Cost Database Development is essential for improving efficiency.


Integrating a robust Construction Cost Database Development strategy can enhance project outcomes.


Feature / Metric Internal Cost Data  Traditional Market-Average Databases (e.g., RSMeans, Bni) Locally Researched Open Databases (e.g., 4BT OpenCOST)
Primary Use Case Conceptual historical benchmarking Early-stage conceptual budgeting Procurement-ready estimating, JOC, & contractor/subconstractor bid validation
Data Basis Proprietary internal project history National averages adjusted by City Cost Indexes (CCI) Granular, independent local market research
Localization Precision Limited to specific locations of past projects Broad Metropolitan Statistical Areas (MSAs) via factor formulas Localized down to specific sites and/or regional sub-markets
Cost Visibility & Transparency High internal visibility; completely opaque to outside markets Opaque; hidden procurement research sites and source data Fully transparent; verifiable and auditable line-item tracking
Specialized Trade Capability Subject to historical experience; weak for new or niche trades Poor; relies on general localization indexes spanning all trades High; independent research tracks specialized trade rates, taxes, insurance, fringes…
Update Frequency Delayed; dependent on manual “project actuals” entry Static; typically quarterly for indexes and annual publishing cycles for cost books Continuous; real-time dynamic market monitoring with quarterly updates for individual location specific databases
Granularity Level Varied; often high-level assemblies or macro-costs Mid-level; traditional  assemblies Ultra-high; granular Line-Item (Labor, Material, Equipment + Productivity) with any Assemblies direclty tied to line items.
Audit & Legal Defensibility Low; subjective and unique to one organization’s operations Low; use of location factors limits detailed auditability High; legally defensible for open book procurement and public audits
INTERNAL COST DATA
Using only internal cost data, , presents several limitations that can compromise the value of associated estimates and associated bids/proposals/budgeting.
1. Limited Scope and Benchmarking
    • Market Blind Spots – Internal data is restricted to an organization’s previous project history. It often lacks coverage for new or niche markets, technologies, or means/methods/materials that the firm hasn’t encountered.
    • Lack of Objective Standards – Relying solely on internal figures may introduce organizational bias and prevents objective benchmarking against broader industry standards or verifiable databases like 4BT. 

2. Normalization and Data Quality Issues
    • Structural Inconsistencies – Aggregating and normalizing project data is notoriously difficult; many internal databases lack a standard data architecture and/or Work Breakdown Structure (WBS) or use inconsistent “sort fields” that make comparing projects across different regions nearly impossible.
    • Stale Data – Internal records can become outdated quickly if not systematically updated with current “project actuals,” leading to significant costing errors.

3. Granularity and Predictability
    • The “Granularity Gap” – Internal data often centers on historical averages or high-level assemblies rather than the granular, locally researched unit prices required for procurement-ready estimates.

4. Workflow Inefficiencies
  • Data Silos – Estimates can become trapped on individual machines or in messy spreadsheets, leading to a constant cycle of exporting and cleaning data before it can be used for centralized cost modeling.
  • Manual Entry Risks: Without external data integration, estimators may spend hours manually transferring data to meet client requirements or bid forms, increasing the risk of costly mistakes.
NATIONAL AVERAGE COST DATA
Traditional national average cost data, while widely used,  operates primarily as a budgetary tool utilizing broad geographic location factors and market averages, which introducs significant cost errors and lacks the verifiable, locally researched line-item specificity required for procurement-ready estimates.
The following limitations arise when relying on market-average databases like for cost visibility and management:
1. Inaccurate Localization Methodology
    • Factor-Based Errors: Reliance on city cost indexes or area cost factors applied to a national average, fails to capture true local market realities, localized labor shortages, and granular material variations.
    • Major City Averaging: National average cost data is general based upon broad metropolitan statistical areas (MSAs), completely missing distinct pricing variances between neighboring areas.
2. Lack of Verifiability and Transparency
    • Hidden Research Sites: Databases may not publish or disclose  specific material, labor, or equipment procurement research sites, making the underlying data unverifiable for estimators.
    • Questionable Validation: Because the line-item costs cannot be audited against real-world, costs for all individual trades and all associated costs per trade,  strict audit or procurement scrutiny is questionable.
3. Inadequate Handling of Specialized Trades
    • Industrial Blind Spots: Broad indexes struggle to accurately price complex, specialized industrial trades.
4. Limited Cost Visibility
    • Budgetary Only: It serves well for high-level, early-stage conceptual budgeting but fails as a tool for detailed, procurement-level cost control.
    • No Competitive Benchmarking: Relying on its generalized market averages prevents estimators from identifying localized cost-saving opportunities or driving precise cost management during construction execution.
    • Outdated Update Frequencies: Real-time market volatility for volatile commodities (like steel, copper, and concrete) is frequently missed by indexing or annual database publishing cycles.

Construction Cost Database Development

Construction Cost Database Development

← Back

Thank you for your response. ✨

via Four BT, LLC (4BT) Construction Cost Data Intelligence and Efficient Project Delivery Solutions


Historical Construction Cost Data

While historical construction cost data can provide broad benchmarking context, square-foot or assembly-level “historical cost” databases are often of limited value for reliable estimate validation or procurement decisions.


Their usefulness declines significantly when applied across different markets, labor conditions, specification levels, schedules, or regulatory environments. Numerous industry studies and real-world bid comparisons demonstrate that generalized historical cost models routinely produce errors ranging from 30% to well over 100% when compared to actual local labor, material, equipment costing.

The more defensible approach is detailed, line-item cost validation using objective, current, standardized, and local construction cost data—particularly unitized labor, material, equipment, productivity, subcontractor, and logistics inputs updated continuously to reflect real market conditions. Systems such as localized 4BT/OpenCost(tm)-style databases provide materially higher accuracy because they evaluate actual work scope rather than relying on normalized historical averages or location multipliers layered onto outdated projects.

Integrating advanced data analytics tools that can track real-time cost fluctuations and project performance can lead to more accurate forecasting.

Historical databases also suffer from several structural weaknesses:

  • Embedded project-specific inefficiencies or anomalies become institutionalized.
  • Escalation and normalization assumptions are highly subjective.
  • Scope definitions are rarely consistent between projects.
  • Contractor means-and-methods vary substantially.
  • Labor productivity and subcontractor availability fluctuate regionally.
  • Inflationary periods rapidly invalidate older benchmark data.
  • Square-foot metrics conceal major specification and systems differences.


In practice, two buildings with similar square footage can differ in cost by multiples due to structural systems, MEP intensity, energy standards, phasing constraints, site logistics, unionization, procurement timing, or local code requirements. As a result, high-level historical metrics are often better suited for conceptual screening than for serious estimate validation.

Understanding the variances in project costs emphasizes the need for detailed project planning. For instance, if two buildings, both sized at 10,000 square feet, incorporate different foundation types—one shallow and one deep pile foundation—the cost implications can be substantial. In such cases, referencing historical construction cost data can help project teams assess whether they are on target or if adjustments are necessary.

For effective Total Cost Management, the industry should move toward:

Furthermore, engaging in consistent communication with subcontractors regarding their pricing strategies can help illuminate any changes in material costs or labor expectations that may arise. As a practical example, a subcontractor may indicate a rise in steel costs due to trade tariffs, prompting the project manager to reassess their budget and sourcing strategies.

  • granular line-item databases,
  • continuously updated local pricing,
  • transparent productivity assumptions,
  • objective quantity-based benchmarking,
  • and standardized classification systems tied to actual scope and constructability.

Historical databases remain useful as secondary reference tools, but they should not be treated as primary validation mechanisms where procurement accuracy, budget certainty, or fiduciary oversight are important.

In conclusion, utilizing historical construction cost data effectively requires a comprehensive understanding of the various factors that influence costs. By focusing on detailed, real-time factors rather than relying solely on generic historical data, contractors can create more accurate estimates and ultimately enhance their project’s financial outcomes.

Value centric Job Order Contracting

Cost Tracking to Cost Management

← Back

Thank you for your response. ✨


Four BT, LLC (4BT) – Exclusive supplier of current, objective, verifiable, local market granular cost data for repair, renovation, maintenance, and new builds and associated technology and support services.

Key Advantages of 4BT JOC

Key Advantages of 4BT JOC Program Over Traditional Methods

Higher Visibility: Provides 30%–40%+ higher cost visibility compared to “market-leading” national average cost data.

Locally Sourced Data: Reflects actual local labor productivity and costs rather than adjusted averages.

Robust Data Structure: Organizes data using expanded CSI MasterFormat for detailed, line-item accuracy, including preventive maintenance.

Proven Reliability: 4BT OpenCOST(TM) is used by public sector departments to improve project delivery and budgetary certainty.


Value of Localized Data vs. National Average Cost Data & Location Factoring

Accuracy & Transparency: Instead of applying generic location multipliers to national averages, 4BT researches labor, material, and equipment costs directly in the local market, improving visibility and creating actionable, defensible estimates.

Reduced Risk & Disputes: By using current, granular line items (over 90,000) that reflect actual market conditions, projects on 4BT OpenCOST reduce reliance on contingencies, lowering cost overruns and legal disputes.

Quarterly Updates: Unlike national books updated annually, 4BT updates data quarterly, which is crucial for capturing rapid local market fluctuations in labor and material prices.

Key Advantages of 4BT JOC


Consequences of Lacking Owner Support

  • Inconsistent Management: Without direct, engaged owner oversight, building management becomes reactive rather than proactive, focusing only on failures (e.g., repairing a roof) rather than long-term performance. Lack of dedicated ownership can lead to inefficient operations.

Key Actions for Owner Leadership

  • Embrace Outcome-Based Accountability: Moving away from rigid, task-based management to rewarding outcomes allows project teams to adopt innovative, sustainable solutions.
  • Invest in Training: Invest in developing leadership capabilities that emphasize sustainability-focused decision-making.
  • Proactive Engagement: Successful sustainable projects require owners to actively engage in planning, design, and operations, rather than just in the financing.

The continued reliance on national cost databases in federal construction is not a data problem—it is a change management failure.

By prioritizing administrative ease over cost accuracy, the system creates:

  • Hidden inefficiencies
  • Reduced transparency
  • Suboptimal outcomes for all stakeholders

Overcoming this barrier requires aligning technology, policy, and oversight toward a single objective:  accurate, transparent, and locally relevant cost data that fulfills the true intent of “fair and reasonable” pricing.


← Back

Thank you for your response. ✨


National average cost data and location factoring is outdated.

Locally researched, quarterly updated construction cost data that eliminates the 30%–40%+ inaccuracies inherent in national averages and location multipliers is the new standard. This verifiable, standardized (CSI MasterFormat) data delivers superior budget accuracy, transparency, and reduced disputes for repair, renovation, and new construction, unlike traditional annual, averaged data books.

Captial Delivery Cost Management

Capital Delivery Cost Management Requires Cost Visibility. 

Facilities management (FM), repair and maintenance (R&M), and construction delivery is fundamentally constrained by a lack of cost visibility, a situation that routinely produce cost impacts in the range of 30–40% or higher Current, objective, standardized granular cost data can greatly improve capital delivery cost management if used throught the lifecycle of preconstruction through operations.

The Scale of the Problem

Across FM, R&M, and capital delivery programs, poor cost visibility leads to:

  • 30–40%+ total cost inefficiency across maintenance, repair, and capital delivery
  • Budget overruns of 15–25% on average
  • Extreme cases exceeding 200%, particularly in poorly scoped or fast-tracked projects

These outcomes are not isolated incidents—they are systemic and predictable in environments where decision-making is disconnected from accurate, current cost data (Flyvbjerg, 2009; McKinsey & Company, 2017)

Organizations operating without reliable, granular cost data experience:

  • Persistent budget overruns
  • Inefficient procurement outcomes
  • Misallocation of capital resources
  • Reduced credibility with stakeholders
  • Increased audit and compliance risk

Factors Impacting Cost Visbility

  1. Owner capacity, leadership, and accountability
  2. Construction deliver method and team makeup
  3. Detailed scope of work creation methodology
  4. Cost data source
  5. Integration of cost and schedule


Ineffective Cost Validation Through Bidding

Competitive bidding is frequently treated as a proxy for cost accuracy. In practice:

  • Bids reflect market behavior, not verified cost
  • Outlier pricing often goes undetected without independent baselines
  • Low bids can result in downstream change orders and claims

Effective cost control requires independent, line-item cost validation, not just comparative pricing (Love et al., 2016).


Transitioning to Improve Cost Certainty

Achieving cost control requires a shift from assumption-based estimating to data-led costing:

A Single Source of Truth

Establish a unified and transparent cost framework used across:

  • Planning
  • Procurement
  • Project Delivery Execution
  • Operations
  • Audits

Locally Researched Cost Data

Replace generalized assumptions with:

  • Verified local labor rates[1]
  • Current material pricing
  • Trade-specific production metrics

Granular Line-Item Visibility

  • Detailed task-level costing
  • Continuous validation of costs
  • Early identification of anomalies


Linking cost directly to performance

  • Real-time decision-making
  • Predictive risk management
  • Proactive intervention

Captial Delivery Cost Management

Conclusion

Captial Delivery Cost Management is not achieved through tighter budgets or procurement pressure—it is achieved through cost visibility.

Organizations that rely on fragmented systems, generalized cost assumptions, and unverified pricing will continue to experience substantial inefficiencies. In contrast, those that adopt data-led, locally validated, and fully integrated cost systems can significantly reduce waste, improve accuracy, and move toward true cost certainty.

Four BT, LLC (4BT) provides cost data intelligence and robust process solutions for the built environment.

References

Azhar, S., Khalfan, M. and Maqsood, T. (2011) ‘Building information modelling (BIM): now and beyond’, Australasian Journal of Construction Economics and Building, 12(4), pp. 15–28.

Flyvbjerg, B. (2009) ‘Survival of the unfittest: why the worst infrastructure gets built—and what we can do about it’, Oxford Review of Economic Policy, 25(3), pp. 344–367.

International Organization for Standardization (ISO) (2017) ISO 15686-5: Buildings and constructed assets—Service life planning—Part 5: Life-cycle costing. Geneva: ISO.

Love, P.E.D., Edwards, D.J. and Irani, Z. (2013) ‘Moving beyond optimism bias and strategic misrepresentation: an explanation for social infrastructure project cost overruns’, IEEE Transactions on Engineering Management, 60(3), pp. 560–571.

Love, P.E.D., Sing, C.P., Wang, X. and Irani, Z. (2016) ‘Overruns in transportation infrastructure projects: an analysis of causes and consequences’, Transport Reviews, 36(5), pp. 615–638.

McKinsey & Company (2017) Reinventing construction: A route to higher productivity. Available at: https://www.mckinsey.com

(Accessed: 8 April 2026).

Olanrewaju, A. and Anahve, P. (2015) ‘Dismantling the myths of cost planning in construction projects’, Journal of Financial Management of Property and Construction, 20(1), pp. 33–52.

Project Management Institute (PMI) (2021) A Guide to the Project Management Body of Knowledge (PMBOK® Guide). 7th edn. Newtown Square, PA: PMI.

4BT (n.d.) Unit Price Book. Available at: https://4bt.us/unit-price-book/ (Accessed: 8 April 2026).

Note: All trademarks and rights remain the solely with their respective owners and no endorsements of any kind are implied or given.


FOUR BT, LLC (4BT) WWW.4BT.US [email protected]


[1] Market average prices books (e.g. RSMeans Cost Data, BNi, etc.) do not provide fully researched cost data for all trades based upon location, including trades specific fringes, etc.


← Back

Thank you for your response. ✨


Beyond Speed: Fixing Cost Visibility Failures in JOC, SABER, and IDIQ Contracting

White Paper

Beyond Speed: Fixing Cost Visibility Failures in JOC, SABER, and IDIQ Contracting

Executive Summary

Job Order Contracting (JOC), Simplified Acquisition of Base Engineering Requirements (SABER), and Indefinite Delivery/Indefinite Quantity (IDIQ) contracts were designed to accelerate procurement. However, their emphasis on administrative speed has systematically undermined cost accuracy, transparency, and control.

The root cause is not contracting structure—but data quality and governance failure. Programs relying on national average cost databases with location factors consistently produce inaccurate estimates, leading to overpayment, audit findings, and erosion of trust.

This paper outlines:

  • Why these programs fail
  • Evidence of systemic cost data deficiencies
  • A practical framework to restore cost visibility and control

Fixing Cost Visibility Failures in JOC, SABER, and IDIQ Contracting

1. The Core Problem: Speed Over Accuracy

JOC/SABER/IDIQ programs prioritize:

  • Rapid procurement cycles
  • Simplified contracting workflows
  • Reduced administrative burden

But they often sacrifice:

  • Granular cost validation
  • Real-time local market alignment
  • Data-driven oversight

This imbalance results in “efficient delivery of inefficient pricing.”

2. Why These Programs Fail

2.1 Inaccurate Cost Data

Most programs rely on:

  • National average Unit Price Books (UPBs)
  • Adjusted using City Cost Indexes (CCI), Area Cost Factors

Documented limitations:

  • Error ranges: –100% to +200% at line-item level
  • Lagging reflection of local market conditions
  • Unsuitable for procurement-level estimating

2.2 Misalignment and Late Detection

  • Poor early coordination between Owner, Contracting, and Contractor
  • Deviations detected only after execution begins
  • Leads to:
    • Disputes
    • Change orders
    • “Death spiral” of mistrust

2.3 Reporting Noise vs. Insight

  • High volumes of UPB line items and reports
  • Limited ability to identify:
    • Cost anomalies
    • Overuse of Non-Pre-Priced (NPP) items
  • Early warning signals are often missed

2.4 Lack of Specialized Expertise

  • Program oversight assigned without:
    • Advanced estimating skills
    • Negotiation expertise
  • Results :
    • Weak validation
    • Systematic overpayment

2.5 Weak Internal Controls

Audit findings consistently identify:

  • Inadequate cost validation processes
  • Project splitting to bypass thresholds
  • Excessive change orders
  • Fraud vulnerability

3. Evidence: The Failure of “National Average + Factor” Models

Government Findings

  • GAO (2020, 2025):
    Estimates using weak methodologies fail accuracy and credibility standards; cost overruns observed (e.g., +14% / $37M variance).
  • DoD Inspector General:
    Cases of extreme overpayment due to lack of market validation (e.g., 80x cost variance on basic items).

Academic Research

  • University of Colorado Denver:
    CCI-based estimates vary by ±20% post-bid
  • Estes (2016):
    RSMeans-based estimates underestimated actual costs by 18%–67%

Industry Consensus

  • International Cost Engineering Council (ICEC):
    Location factors are appropriate only for:

    • Conceptual estimates
    • Not for procurement or appropriation-level decisions

Global Impact of Poor Data

  • $1.8 trillion lost globally due to bad construction data (MSuite, 2022)
  • 14% of rework tied directly to poor data quality

4. The Data Divide: Local vs. Factored Models

Feature

Locally Researched Data (e.g., 4BT OpenCOST™)

Traditional Models

Data Source

Local market surveys

National averages

Accuracy

High (procurement-ready)

Variable, often inaccurate

Update Frequency

Quarterly (1.2M+ data points)

Annual / irregular

Structure

Expanded CSI MasterFormat

Standard MasterFormat

Transparency

Full cost breakdown (labor, material, equipment)

Aggregated pricing

Key Insight:
Factored data estimates approximate cost.
Local data validates cost.

5. Solutions: Restoring Cost Visibility

5.1 Replace National Averages with Local Data

  • Build cost databases from:
    • Local labor rates
    • Material pricing
    • Equipment costs
  • Expected improvement:
    • 30–40% increase in cost accuracy

5.2 Implement Integrated Cost Technology

  • Replace spreadsheets with:
    • Dedicated estimating platforms
    • Real-time dashboards
  • Benefits:
    • Early anomaly detection
    • Automated reporting

5.3 Control Non-Pre-Priced (NPP) Work

  • Target thresholds:
    • <10% (acceptable)
    • <5% (best practice)
  • Reduces pricing opacity and manipulation

5.4 Mandate Specialized Training

Annual training in:

  • Advanced line-item estimating
  • Cost validation techniques
  • Negotiation of task orders

5.5 Establish Measurable Performance Metrics

Track:

  • Estimate vs. actual variance
  • NPP utilization rates
  • Schedule adherence
  • Alignment with local benchmarks
  1. Enabling Lean Construction Principles

A Common Data Environment (CDE) built on verified local data:

  • Aligns all stakeholders
  • Reduces disputes
  • Enables transparent decision-making
  • Supports continuous improvement

Conclusion

The failure of JOC, SABER, and IDIQ programs is not inherent to their structure, it is a data problem.

Reliance on generalized, factored cost databases creates systemic inaccuracies that cascade into:

  • Overpayment
  • Misalignment
  • Audit risk

Transitioning to locally verified, granular cost data, supported by technology and training, transforms these programs from:

References

  • Government Accountability Office (GAO) (2020; 2025) Cost Estimating and Assessment Guide and related audit findings.
  • Department of Defense Inspector General (DoD IG) (various reports) Audit Reports on Procurement and Cost Validation Failures.
  • Estes, A.C. (2016) Comparison of RSMeans Data to Local Construction Costs, Journal of Construction Engineering.
  • University of Colorado Denver (n.d.) Analysis of City Cost Index Variability in Construction Estimating.
  • International Cost Engineering Council (ICEC) (n.d.) Best Practices in Cost Estimating.
  • MSuite (2022) The Cost of Bad Data in Construction.
  • 4BT OpenCOST™ (2024) Methodology and Data Structure Overview.

Note:  All trademarks and rights remain solely with their respective owners.  No endorsements of any kind are implied or given.

Unit Price Books and the Foundation of Defensible Construction Cost Management

Locally researched, granular Unit Price Books (UPBs) represent the most reliable and defensible foundation for procurement, cost control, and program delivery—particularly in Job Order Contracting (JOC), SABER, IDIQ, IPD, and similar frameworks.  Accurate construction cost management depends on the quality, structure, and origin of underlying cost data. While many organizations rely on historical, conceptual, or national-average cost datasets, these approaches frequently fail to reflect actual market conditions.


1. Introduction

A Unit Price Book (UPB) is a structured database of detailed construction tasks with associated unit costs covering labor, material, and equipment components. Unlike conceptual or square-foot estimates, UPBs provide line-item transparency, enabling accurate pricing of discrete work activities. Utilizing unit prices books enhances the reliability of cost assessments and project planning, ensuring accurate budgeting through detailed analysis of unit prices books. The incorporation of effective unit prices books in construction management is crucial for achieving cost efficiency and project success.

Despite their importance, many owners and program managers continue to rely on:

Incorporating unit prices books into your procurement strategy can significantly improve cost management and project outcomes.

Understanding the role of unit prices books can lead to more informed decision-making in construction project management.

Emphasizing the importance of unit prices books in procurement strategies can lead to improved decision-making processes.

  • Historical project cost data
  • National average cost books (with/without location factors, area cost factors, economic indexes)
  • Assemblies or parametric estimates

These methods lack the precision necessary for procurement-grade decision-making.


2. The Problem with Traditional Cost Data

National cost databases (e.g., widely used cost books) are built on aggregated data and adjusted using location factors and indices . While useful for early-stage budgeting, they introduce systemic inaccuracies:

Key Limitations:

  • Localization error due to generalized indices
  • Lack of task-level granularity
  • Embedded assumptions on productivity and conditions
  • Delayed updates vs. real market conditions

Research and industry evidence indicate that reliance on national-average data can result in cost variances of 30–40% when applied to local projects .


3. What Defines a High-Quality Unit Price Book

A defensible UPB must meet five core criteria:

1. Local Market Accuracy

Costs derived from direct local research, not adjusted national averages.

2. Granularity

Detailed line items representing discrete construction tasks (often tens of thousands of items).

3. Transparency

Clear breakdown of:

  • Labor
  • Material
  • Equipment
  • Productivity assumptions

4. Standardization

Structured using industry frameworks such as CSI MasterFormat for consistency and interoperability.

5. Currency

Updated frequently (e.g., quarterly) to reflect real-time market conditions.

Failure in any of these areas undermines cost reliability and introduces financial risk.


4. Why Unit Price Books Enable True Cost Management

Most organizations TRACK costs—few actively MANAGE costs.

Tracking Costs:

  • Records historical expenditures
  • Reactive and backward-looking

Managing Costs:

  • Uses real-time, actionable data
  • Enables forecasting and control
  • Supports procurement decisions

A properly structured UPB enables:

  • Pre-award cost validation
  • Transparent contractor pricing
  • Reduced change orders
  • Improved scope definition

This aligns with best practices in construction economics and contract structuring, where unit price-based approaches improve pricing clarity and adaptability (Khalafalla et al., 2025).

unit price books


5. Implications for JOC, SABER, and IDIQ Programs

In Job Order Contracting environments, the UPB becomes the contractual pricing mechanism. Poor-quality cost data leads directly to:

  • Inflated quantities or hidden scope adjustments
  • Reduced competition transparency
  • Increased lifecycle costs

Conversely, a high-quality UPB provides:

  • Auditability
  • Consistency across task orders
  • Alignment between owner and contractor expectations

6. Conclusion

The effectiveness of any construction program is directly tied to the quality of its cost data.

Organizations that continue to rely on generalized or historical datasets are not managing cost—they are reacting to it.

A locally researched, granular, and continuously updated Unit Price Book is not simply a tool—it is the foundation of defensible cost management, procurement integrity, and program success.


References


Learm more…  https://4bt.us/unit-price-book/


Why is FM Non-Strategic

The decades old question remains ” Why is FM Non-Strategic ” for most organizations.
Applying  Occam’s razor, the answer is simple.   Without consistent, capable, supportive, and accountable senior leadership, FM is relegated to reactive maintenance rather than proactive, data-driven lifecycle management.   This prevents FM from efficiently aligning with core organizational strategies.

Why Lack of Leadership Causes FM to be Non-Strategic
  • Reactive vs. Proactive Culture: When leadership is not present or competent, FM defaults to “maintenance”—fixing things when they break—instead of strategic “facilities management,” which involves using data and systems to extend asset life and improve productivity.  This causes the endemic pervasive waste and inefficiency from both financial and economic and environmental perspective.
  • Lack of Accountability and Stewardship: Without consistent, accountable leaders, organizations fail to continuously develop staff and external partners, robust processes, and actionable information, leading to fragmented, inefficient, and wasteful project delivery.
  • “Disconnected” Decision-Making: Organizations often lack the current, reliable data required for informed decision-making because leaders fail to demand or use it for lifecycle modeling.
  • Missed Strategic Alignment: Executives often fail to treat FM as a partner, missing opportunities to integrate facility performance with business productivity, safety, and compliance goals.
Reversing the Trend
To transition from a support function to a strategic asset, 4BT advocates that FM organizations must:
  • Engage leadership directly in the development of staff and external service providers.
  • Adopt LEAN, collaborative practices and Integrated Project Delivery (IPD) framework to maximize people, processes, and technology, as well as integrate planning, procurement, and project delivery teams.
  • Utilize verifiable local cost data and actionable information for asset lifecycle management.
  • Shift from “project-centric” thinking to a continuous, integrated management approach.

Effective facility management requires leadership that can transition from “command and control” to a collaborative, data-driven approach that supports the overall organizational mission.

Here is the breakdown of why that specific gap keeps FM from the “big table”:
  • The “Invisible” Curse: Without continuous competent and accountable leaders to advocate for the long-term value of the built environment, FM is only noticed when things break. If the lights are on, leadership assumes everything is fine and cuts the budget.
  • Tactical vs. Strategic: Leadership tends to focus on “putting out fires” (reactive maintenance) instead of lifecycle planning or energy efficiency. This keeps the department in a perpetual state of catch-up.
  • Lack of Data-Driven Advocacy: Accountability requires tracking the right metrics (like ROI on preventative maintenance). Without a leader who can translate “boiler repairs” into “business continuity and risk mitigation,” strategic connections cannot be formed.
  • The Funding Gap: When leadership isn’t continuous, there’s no “owner” for 10-year capital plans. This leads to deferred maintenance, which eventually becomes so expensive that the organization stays in survival mode rather than strategic growth.
Essentially, if the person at the top doesn’t speak the language of the business, FM remains an expense rather than a strategic resource.
Why is FM Non-Strategic

← Back

Thank you for your response. ✨

Four BT, LLC – FM Cost Data Intelligence and Cost Managment Solutions

Verifiable Construction Estimating

Verifiable Construction Estimating drives cost visibility and cost management. This innovative approach helps project managers and stakeholders understand the intricacies of budgeting and resource allocation in construction projects. By leveraging detailed data, construction teams can ensure accuracy in their financial assessments and avoid unexpected financial pitfalls.

Building estimates from standardized (coded with expanded CSI Masterformatin), current, objective, and verifiable granular tasks replete with labor, material, equipment, and productivity is the ONLY PATH TO COST VISBILITY through Verifiable Construction Estimating! This methodology promotes accountability and transparency, allowing teams to measure performance against actual costs and timelines, thus enhancing project delivery and efficiency.

PEOPLE, PROCESS, INFORMATION, and enabling TECHNOLOGY all play their part in ensuring that construction projects are executed successfully. Each element interacts with the others, creating a synergy that leads to optimized outcomes. Training individuals in the use of these technologies enhances team performance and fosters a culture of continuous improvement.

Implementing Verifiable Construction Estimating ensures that PEOPLE, PROCESS, INFORMATION, and enabling TECHNOLOGY all play their part effectively. This holistic approach addresses the common challenges in construction project management, such as miscommunication and budget overruns, by fostering a collaborative environment where all team members are informed and engaged.

Understanding Verifiable Construction Estimating

ALL COST ARE LOCALLY RESEARCHED (no use of location factoring, location indexing, or econonic indexing, market average databases, etc.)

✅Labor costs tracked properly, providing an accurate picture of expenditure and enabling better budget forecasts.

✅Detailed Scope of Work well formatted and communicated, ensuring everyone understands project goals and responsibilities, minimizing errors during execution.

✅Material costs reflect local market prices, allowing for a more realistic budget and reducing financial risks associated with price fluctuations.

✅Local equipment costs are considered, which helps in  estimating the total cost of ownership and operational expenses.

✅Data carried forward for future use aids in learning from past projects, allowing teams to refine their estimating practices and improve accuracy over time.

✅Value engineering enabled, encouraging teams to explore alternative methods and materials that can lead to cost savings while maintaining quality.

Build cost estimates with confidence and real data, not assumptions. This shift away from traditional estimating methods towards data-driven practices equips teams with the insights needed to make informed decisions and achieve better financial results.

➡️Local Market Cost code libraries, exclusively from 4BT (repair, renovation, maintenance, preventive maintenance, new construction), ensure that estimators have access to the most relevant and accurate pricing information, which is essential for effective budgeting.

➡️Clear visibility on cost build-up allows project managers to track expenses in real-time and adjust strategies as needed to stay within budget.

➡️Better control of margin enables organizations to safeguard their profitability by analyzing costs and identifying areas for improvement.

➡️Reliable, consistent data across multiple requirements and stakeholders strengthens collaboration and trust among team members, leading to smoother project execution.

Move FROM traditional estimating to data-led costing! Embracing technology in estimating processes not only boosts efficiency but also improves the overall quality of data used in decision-making.

If this is something your organization could benefit from, book an appointment and see how estimating is changing — and what it takes to improve efficiency for owners and design/builders. Leveraging Verifiable Construction Estimating can lead to significant project savings and a more predictable outcome. Verifiable Construction Estimating JOC SABER IDIQ Improvement Verifiable Construction Estimating

← Back

Thank you for your response. ✨

From Cost Tracking to Cost Management (FM – AECOO)

Transforming Facilities Investment Through Data Precision

Executive Summary

Most real property owners, facilities managers (FM), and design/build teams operate in a paradigm of cost tracking rather than cost management. While tracking records what has been spent, it does little to influence future outcomes, optimize decision-making, or ensure value delivery.

Transitioning from cost tracking to cost management is essential for optimizing financial outcomes.

This white paper notes that true cost management requires the use of current, verifiable, granular, standardized, and objective cost data for repair, renovation, maintenance, and new construction. Critically, this data must be separated from contractor overhead and profit (O&P) to enable transparency, comparability, and strategic control.

Understanding the shift from cost tracking to cost management allows organizations to unlock potential savings.

Organizations that rely on historical costs, national average cost data and location factoring, or lump-sum pricing models expose themselves to cost escalation, inefficiency, and loss of negotiating leverage. In contrast, those adopting a data-driven cost management approach gain predictive control, improved procurement outcomes, and measurable best value.

When organizations focus on moving from cost tracking to cost management, they foster a culture of proactive financial stewardship.

From Cost Tracking to Cost Management

1. The Industry Problem: Cost Tracking vs. Cost Management

The distinction between cost tracking and cost management is crucial for effective resource allocation.

1.1 Cost Tracking Defined

Cost tracking is the retrospective recording of expenditures. It answers the question:

Effective cost management transcends basic cost tracking by incorporating predictive analytics.

“What did we spend?”

Typical tools include: – Financial reporting systems – Budget vs. actual comparisons – Historical project cost archives

While necessary for accounting and compliance, cost tracking is inherently reactive.

1.2 Cost Management Defined

Investing in training can aid teams in understanding the nuances of transitioning from cost tracking to cost management.

Cost management is the proactive control of costs throughout the asset lifecycle. It answers:

“What should this cost, and how do we ensure it does?”

It requires: – Current and forward-looking data – Real-time validation – Decision support tools – Transparent cost structures

1.3 The Gap

Most organizations attempt to manage costs using tools designed for tracking. This mismatch leads to: – Overreliance on outdated or irrelevant data – Acceptance of opaque pricing structures – Limited ability to challenge contractor pricing

It’s vital to recognize the difference between merely tracking costs and implementing effective cost management strategies.

2. Limitations of Traditional Cost Approaches

2.1 Historical Cost Data

Historical data reflects past conditions, not current realities. Market volatility, labor changes, and material cost fluctuations render such data unreliable for forward planning.

2.2 National or Regional Averages

Cost databases based on averaged data obscure local variability and project-specific conditions. These datasets: – Lack granularity – Mask real cost drivers – Require error prone location factors

2.3 Cost Factoring and Indexing

Applying escalation factors or location indices introduces compounding uncertainty. Each adjustment layer increases the margin of error.

Many firms still struggle to separate cost tracking from the advanced methodologies required for true cost management.

2.4 Lump Sum Pricing

Lump sum quotes: – Obscure underlying cost components – Prevent benchmarking – Embed unknown risk premiums

This approach shifts control from the owner to the contractor.

3. The Foundation of True Cost Management

Effective cost management is built on five key attributes of data:

Adopting a framework for transitioning from cost tracking to cost management can significantly enhance project success.

3.1 Current

Data must reflect real-time market conditions.

3.2 Verifiable

Each cost element must be traceable and auditable.

3.3 Granular

Costs should be broken down to unit-level components (labor, material, equipment), with associated productivity information.

3.4 Standardized

Uniform structure enables comparison across projects and time (e.g. expanded CSI Masterformat)

3.5 Objective

Data must be independent of contractor influence and free from embedded profit and overhead.

4. Separating Cost from Price: The Role of O&P

By understanding the role of accurate data, organizations can improve their transition from cost tracking to cost management.

A critical distinction exists between cost and price.

  • Cost: Direct expenses for labor, materials, and equipment
  • Price: Cost plus overhead and profit (O&P)

Most industry practices conflate the two, limiting transparency.

4.1 Why O&P Separation Matters

Removing O&P from baseline cost data allows: – Apples-to-apples comparison – Objective validation of contractor proposals – Flexible procurement strategies

4.2 Implications for Owners

Owners gain the ability to: – Negotiate O&P independently – Benchmark performance – Reduce contingency padding

5. Applications Across the Asset Lifecycle

5.1 Repair and Maintenance

Granular cost data enables: – Accurate work order pricing – Elimination of inflated service costs – Improved budgeting accuracy

Granular data aids in the shift from cost tracking to cost management by promoting precision in financial planning.

5.2 Renovation and Modernization

Detailed cost breakdowns support: – Scope validation – Value engineering – Real-time cost control

5.3 New Construction

Cost management enhances: – Design-to-budget alignment – Early-stage estimating accuracy – Risk reduction

6. Strategic Benefits of Cost Management

Organizations that transition from tracking to management achieve:

6.1 Predictive Control

Ability to forecast costs with confidence

6.2 Procurement Leverage

Improved negotiating position through data transparency

6.3 Cost Reduction

Elimination of unnecessary markups and inefficiencies

6.4 Performance Accountability

Clear metrics for contractor evaluation

6.5 Best Value Delivery

Alignment of cost, quality, and performance outcomes

7. Implementation Framework

7.1 Establish a Standardized Cost Database

  • Unit-based pricing
  • Trade-level detail
  • Regular updates

7.2 Integrate with Procurement Processes

  • Use data to validate bids
  • Require cost breakdowns

7.3 Train Stakeholders

  • Educate FM teams and procurement staff
  • Align internal processes

7.4 Leverage Technology

  • Digital estimating platforms
  • Real-time data integration

8. Conclusion

The transition from cost tracking to cost management represents a fundamental shift in how organizations approach facilities investment. By adopting current, verifiable, granular, standardized, and objective cost data—independent of overhead and profit—owners can move from passive record-keeping to active financial control.

Ultimately, the evolution from cost tracking to cost management is not just beneficial; it is critical for maintaining competitive advantage.

In an era of increasing cost pressure and accountability, this shift is not optional. It is essential for achieving best value and long-term asset performance.

“You cannot manage what you cannot see.

Granular, objective cost data transforms spending into strategy.”

Fourt BT, LLC exclusively provides current locally researched, standardized, verifiable cost data spanning repair, renovation, maintenance (including preventive maintenance), and new construction.

References (Harvard Style)

Ashworth, A. and Perera, S. (2018) Cost Studies of Buildings. 6th edn. London: Routledge.

Eastman, C. et al. (2011) BIM Handbook: A Guide to Building Information Modeling. 2nd edn. Hoboken: Wiley.

Ferry, D. and Brandon, P. (2013) Cost Planning of Buildings. 8th edn. Oxford: Wiley-Blackwell.

Kirkham, R. (2007) Ferry and Brandon’s Cost Planning of Buildings. Oxford: Blackwell.

Smith, J. (2014) ‘The role of cost data in construction procurement’, Journal of Construction Engineering and Management, 140(5), pp. 1–9.

U.S. Government Accountability Office (GAO) (2020) Cost Estimating and Assessment Guide. Washington, DC: GAO.

Improving DoD JOC and SABER Programs: Strategy and Cost Accuracy

JOC SABER IDIQ Improvement
I. Strategic Program Enhancements
To improve Department of Defense (DoD) Job Order Contracting (JOC) and SABER programs, focus on enhancing collaborative relationships, streamlining administrative processes, and ensuring technical precision in project scoping.
1. Strengthen Collaboration and Culture
  • Shift to “Lean JOC”: Adopt a programmatic, lifecycle-based implementation that emphasizes transparency and continuous improvement.
  • Establish Joint Advisory Teams: Create a combined team of owners, consultants, and contractors to proactively resolve issues before they escalate.
  • Mandatory Partnering Workshops: Integrate formal partnering into the contract to align stakeholder objectives.
2. Optimize Procurement and Solicitation
  • Set Realistic Dollar Limits: Include reasonable annual minimum and maximum dollar amounts. Higher minimum guarantees often lead to lower, more competitive contractor coefficients.
  • Mandatory Training: Require all personnel involved in source selection to undergo specific JOC training.
  • Incentivize Performance: Incorporate award fees or incentive provisions to motivate contractors toward higher quality and faster delivery.
3. Improve Technical Execution
  • Validate Unit Price Books (UPB): Ensure the UPB is tailored to local economic conditions.
  • Limit Non-Pre-Priced (NPP) Work: Keep NPP work below 10% (ideally 5%) of the total order value to maintain the streamlined nature of JOC.
  • Leverage Shared IDIQs: Band together with other bases to share an IDIQ contract, attracting higher-quality contractors through larger work volumes.

II. Technical Analysis: UPB Methodologies and Factoring Issues
Selecting between national averages with location factors and locally researched cost books is critical for maintaining program health and contractor participation.
1. Market Average UPBs with Location Factoring
Most traditional programs utilize commercial databases like RSMeans. These provide national average costs for labor, materials, and equipment.
  • Location Factoring: Users apply a City Cost Index (CCI) or DoD Area Cost Factor (ACF) to adapt national averages to a specific installation.
  • The Gap: Research (Migliaccio, 2013; Martinez, 2010) indicates that national indices often fail to capture real-time local market shifts, leading to significant variances between estimated and actual bid costs.
  • The “Double Factoring” Risk: Applying multiple adjustment factors (e.g., a contractor coefficient on top of an already adjusted CCI) can lead to compounded inaccuracies that do not reflect local vendor realities.
2. Locally Researched Cost Books
Modern DoD best practices favor UPBs built “from the ground up” using local market data, bypassing factoring entirely.
  • Direct Local Inputs: These use local Davis-Bacon labor rates and current market-specific material quotes.
  • Increased Accuracy: Utilizing locally researched data can improve cost visibility by 30-40% compared to national averages.
  • Transparency: Provides an auditable “common language” that reduces friction during joint scope-walks and negotiations.

III. References (Harvard Style)
  1. Department of Defense (2024) UFC 3-701-01 DoD Facilities Pricing Guide. Washington, DC: U.S. Department of Defense. Available at: www.wbdg.org (Accessed: 19 March 2026).
  2. Four BT, LLC (2024) The Issues Associated with Using Location Factors and National Average Cost Databases. Available at: https://4bt.us (Accessed: 31 March 2026).
  3. Martinez, A. (2010) Validation of methods for adjusting construction cost estimates by project location. Master’s Thesis. University of New Mexico UNM Digital Repository. Available at: digitalrepository.unm.edu (Accessed: 19 March 2026).
  4. Migliaccio, G.C. (2013) ‘Empirical Assessment of Spatial Prediction Methods for Location Cost Adjustment Factors’, Journal of Construction Engineering and Management, 139(7). doi: 10.1061/(ASCE)CO.1943-7862.0000652.
  5. Peitlock, B.A. (1998) ‘Developing Location Factors Using a Factoring Method’, ICEC International Cost Management Journal (ICMJ). International Cost Engineering Council.
  6. RSMeans (2023) Building Construction Costs. Available at: https://www.rsmeans.com/66001s-building-construction-costs (Accessed: 14 March 2026).
  7. University of Colorado Denver (2017) Validation of Project-level Construction Cost Index Estimation Methodology. Denver: College of Engineering and Applied Science.
  8. Washington State Department of Enterprise Services (2022) Job Order Contracting (JOC) Best Practices Guidelines. Available at: wa.gov (Accessed: 31 March 2026).
Trademark and Rights Disclosure
All  trademarks, service marks, and trade names are the property of their respective owners. All rights reserved.
Reference to these trademarks is for comparative and informational purposes only and does not imply endorsement, affiliation, or sponsorship by the trademark holders.

← Back

Thank you for your response. ✨


JOC Program Pros and Cons

A comprehensive review of JOC Program Pros and Cons can provide valuable insights and strategies for improving overall performance for both owners and design/builders in the competitive construction landscape. Understanding the intricacies of this program is essential for stakeholders aiming to maximize efficiency and cost-effectiveness.
Major issues facing Job Order Contracting (JOC) include insufficient owner oversight, misuse of the system to bypass competitive bidding, and reliance on inaccurate, non-local unit price books.

For example, insufficient oversight can lead to discrepancies in project costs that can escalate beyond initial estimates. To combat these challenges, programs can be improved by mandatory specialized training, implementing independent third-party audits, utilizing localized cost data, and strengthening performance metrics. This way, organizations can increase transparency and accountability within their JOC programs.

Job Order Contracting (JOC) is a construction procurement method that provides a streamlined approach to delivering repair, renovation, and maintenance projects. The JOC method can be particularly beneficial for organizations with ongoing construction needs, allowing them to quickly mobilize resources and get projects underway without the delays associated with traditional bidding processes. However, it is essential for organizations to fully understand the implications of using JOC, including the potential pitfalls and best practices for implementation.

Understanding JOC: An Overview

Major Issues Facing JOC Programs:

Detailed Examination of Major Issues Facing JOC Programs

A thorough understanding and consistent application of JOC principles can lead to significant savings and improved project timelines. For instance, consider a county government that frequently undertakes maintenance projects; using JOC allows for quicker responses to urgent repair needs, which enhances community satisfaction.

    • Lack of Oversight and Audits:  Improperly designed and managed JOC programs can suffer from weak internal controls, creating risks for fraud, errors, or overpayments.

Each issue facing JOC programs has distinct ramifications. The lack of oversight, for example, can lead to unnecessary costs, while the misuse of procurement can undermine trust in the contracting process. By addressing these issues, organizations can foster a more effective JOC environment.

  • Misuse of Procurement: JOC is sometimes wrongly employed to bypass conventional, transparent bidding processes for projects not suited for it, or for projects that exceed approved monetary limits.
  • Inadequate Training: Programs often fail due to a lack of specialized training for owners and contractors in estimating and negotiating task orders.
  • Non-Local Pricing Data: Using national average price books instead of localized, specific labor/material data leads to poor unit prices and inaccurate project costs.
  • Over-reliance on Non-Prepriced Items: Frequent use of items not in the established catalog reduces the competitive effectiveness of the contract.

How JOC Programs Can Be Improved:

    • Independent Auditing: Require regular, independent third-party audits to ensure compliance and prevent “hidden” costs or improper contractor selection.

Independent auditing, while often considered a burden, can actually be an advantageous practice. Regular audits provide insights into project performance, ensuring that any discrepancies are identified and rectified promptly. This proactive approach not only saves money but also enhances the credibility of the JOC program.

Moreover, mandatory training and certification programs can equip all stakeholders with the necessary tools to navigate JOC complexities. By emphasizing continuous education, organizations can ensure that team members remain up-to-date with industry standards and best practices, which ultimately contributes to the program’s success.

    • Enhanced Performance Metrics: Develop and track Key Performance Indicators (KPIs) to measure efficiency and ensure high-quality, timely work.
    • Proper Project Selection: Restrict JOC usage to appropriate repair, renovation, or construction projects that are not design intensive, ensuring it is not used inappropriately.

Proper project selection is crucial for the success of JOC programs. Ensuring that projects align with the capabilities of JOC helps mitigate risks and enhances the program’s overall effectiveness. Organizations must develop clear criteria for project suitability to maximize the benefits of JOC.

  • Leverage Technology:  Ease-to-use, purpose build technology can help support efficient, robust, secure, and compliant JOC Program processes.

JOC Program Pros and Cons

Learn More…

For further insights into optimizing JOC programs, consider exploring both case studies from organizations that have successfully implemented enhanced JOC strategies, as well as, independent audits of JOC programs. These real-world examples can offer valuable lessons and inspire innovative solutions.

← Back

Thank you for your response. ✨

4bt.usConstruction Cost Intelligence

In conclusion, while JOC Program Pros and Cons highlight both the strengths and weaknesses of this contracting method, a commitment to continuous improvement, training, and oversight can transform these challenges into opportunities for enhanced performance and value. By adopting best practices and learning from past experiences, organizations can leverage JOC to its fullest potential, achieving their construction goals efficiently and effectively.

Construction Cost Intelligence

Construction cost intelligence is a preconstruction requirement crucial for successful project management.

Understanding the intricacies of construction costs significantly influence planning, procurement, project delivery phases, and beyond!

The cost of labor, materials, and equipment are not static; they fluctuate based on various factors including market demand, seasonal trends, and local economic conditions.  Labor variances occur at a granular level based upon trade and location, making it essential for project managers to consider local labor rates when budgeting. For instance, skilled trades like electricians or plumbers may command higher wages in urban areas compared to rural settings, workers compenstation can vary dramatically, et. This localized approach ensures that the estimates reflect the true cost of  professionals in the area.  Additionally, the prices of materials can be affected by location and supply chain issues, including tariff policies.  Tariff and trade policy changes can have a domino effect on both commodities and products used in construction.  Understanding these external factors is vital for accurate cost forecasting.

With 4BT (www.4bt.us), you can access a comprehensive, verifiable estimate of repair, renovation, maintenance, including preventive maintenance, or new build tasks. This includes detailed breakdowns of labor, materials, and equipment costs, which are essential for maintaining a competitive edge in the construction industry.

By leveraging advanced analytics and up-to-date market intelligence, you can enhance both cost visibility and cost management across all stages of project delivery, from initial planning to procurement and final project execution. This holistic approach enables better decision-making, fostering efficiency and profitability in construction projects.

In summary, implementing construction cost intelligence is not merely a trend but a fundamental shift in how projects are managed.

With the right tools and insights, stakeholders can navigate the complexities of modern construction, ensuring projects are completed on time and within budget. As the industry continues to face challenges such as labor shortages and fluctuating material costs, the role of accurate cost data will only become more critical. The future of construction relies on this intelligence to drive efficiency, accountability, and success. By prioritizing construction cost intelligence, companies can position themselves as leaders in a competitive marketplace, ready to tackle the demands of upcoming projects with confidence.

Furthermore, training staff on the importance and utilization of construction cost intelligence tools can exponentially increase the effectiveness of cost management strategies. Workshops and ongoing education can equip team members with the skills to interpret data accurately and apply it in their daily operations. Examples of successful training programs can be tied to industry certifications that focus on advanced estimating techniques and cost analysis methodologies.

Lastly, as the construction industry evolves, adapting to new technologies and methodologies is crucial. Embracing innovations such as Building Information Modeling (BIM) and data analytics can provide deeper insights into the construction process, leading to more informed decision-making. For instance, BIM allows for a visual representation of project costs alongside timelines, helping stakeholders visualize the financial impact of their decisions before they are made.

Additionally, utilizing construction cost intelligence allows project teams to mitigate risks associated with unforeseen expenses. For example, having a detailed understanding of potential cost variations can prepare teams for budget overruns and help secure contingency funds in advance. Incorporating robust data analytics, such as trend analysis and historical data review, empowers project managers to anticipate market fluctuations and adjust their strategies accordingly.

Moreover, fostering transparent communication between stakeholders—including owners, contractors, and suppliers—can enhance collaboration and align expectations. Regular updates and detailed reporting on cost estimates and project budgets can ensure everyone is informed and can make decisions based on the most current data. Implementing project management software that integrates with cost intelligence tools can significantly streamline this process, ensuring that all parties have access to real-time financial insights.

A case study showcasing the effectiveness of construction cost intelligence can be seen in a large-scale commercial project where the initial budget was projected using traditional estimating methods. As the project progressed, unforeseen increases in material costs led to significant budget constraints. However, by integrating a cost intelligence platform, the project team was able to realign their budget and schedule by reallocating resources and adjusting project timelines to mitigate risks. This flexibility allowed the project to stay on track despite market volatility, ultimately leading to successful project completion within budget constraints.


Preconstruction

Construction Cost Intelligence

← Back

Thank you for your response. ✨

#cost #estimates #estimating #accurate #verifiable #detailed #granular #local #current #4bt #costdata #construction #repair #renovatoin #maintenance

FM Cost Management – Public Sector

FM Cost Management in the Public Sector

Why It Fails—and How to Fix It


Executive Summary

Facilities Management (FM) cost control in the public sector remains persistently ineffective—not due to lack of funding or technology, but due to a systemic failure to manage information, process, and leadership. Most organizations do not possess reliable, standardized, or current data about their own assets, making true lifecycle management impossible.

To effectively manage FM costs, organizations can implement comprehensive training programs for staff to ensure everyone understands the importance of accurate data management. For instance, regular workshops can aid in reinforcing the principles of lifecycle management and the significance of utilizing actionable cost data. Additionally, organizations should adopt data verification processes that guarantee the accuracy and reliability of asset information, which is critical for making informed decisions.

The result: 30–40%+ cost inefficiency across repair, maintenance, renovation, and capital delivery.

Moreover, leveraging advanced analytics can significantly reduce inefficiencies in FM. For example, predictive maintenance techniques powered by data analytics can help in anticipating repairs before they become urgent, ultimately leading to lower maintenance costs and improved asset longevity.


Core Problem

Public sector real property owners operate without:

Furthermore, public sector organizations can benefit from developing a centralized database that consolidates all asset information. This centralization fosters better accessibility and sharing of data across departments, which is essential for integrated lifecycle visibility. By utilizing cloud-based solutions, organizations can ensure that all stakeholders have real-time access to the information they need, improving collaboration and decision-making.

    • Verified, standardized cost data
    • Current technical asset information
    • Integrated lifecycle visibility (Planning → Procurement → Delivery → Operations)

Having integrated lifecycle visibility means that all phases of a project—from planning to operations—must be interconnected. This could involve establishing a project management office (PMO) dedicated to overseeing the entire asset management process, ensuring that each stage meets the pre-defined quality and cost standards.

Despite the widespread availability of actionable granular cost data, <1% of owners actively leverage it.

This is not a technology gap—it is a management systems failure.

One practical approach to addressing the management systems failure is to conduct regular audits of the current systems and processes. These audits can identify gaps and inefficiencies, providing a roadmap for improvement. Engaging external consultants can also bring fresh perspectives and expertise that might be lacking internally.


Root Cause: System Failure, Not People

As emphasized by W. Edwards Deming:

“94% of business problems result from faulty systems, processes, and leadership rather than the individuals doing the work.”

Creating a culture of continuous improvement is vital. Organizations can implement feedback loops where employees are encouraged to share their insights on current processes. Recognizing and rewarding contributions can motivate teams to seek out and suggest innovative solutions to persistent issues in FM cost management.

FM inefficiency is driven by:

  • Fragmented and unreliable data
  • Inconsistent processes
  • Lack of accountable ownership
  • Leadership discontinuity

The False Solution: Technology-First Thinking

For decades, organizations have attempted to “solve” FM inefficiency by deploying new platforms:

Moreover, organizations should consider developing pilot programs that test new technologies on a small scale before full implementation. This approach allows for assessing the effectiveness of the technology and its fit within existing processes, ensuring that investments yield tangible benefits.

  • CAFM
  • CMMS
  • IWMS
  • ERP
  • BIM
  • AI-driven systems

Pattern:
Technology is implemented before fixing underlying data and processes.

Outcome:
High cost, minimal impact, continued inefficiency.

FM Cost Management


The Correct Framework: Order of Operations

Effective lifecycle cost management requires disciplined prioritization:

Leadership plays a crucial role in fostering an environment conducive to effective FM cost management. Leaders must articulate a clear vision and set specific performance metrics to guide the organization toward achieving its cost management goals. Regular team meetings can ensure that everyone is aligned with the objectives and aware of their roles in reaching them.

  1. PEOPLE
    • Competent, accountable real property leadership
    • Clear ownership of outcomes
  2. PROCESS
      • Standardized workflows across lifecycle phases

    Furthermore, investing in training that emphasizes standardized workflows can lead to more efficient operations. Employees should be equipped with the skills to follow these workflows consistently, which can dramatically reduce variability and errors in project delivery.

    • Repeatable, auditable practices
  3. INFORMATION
    • Verified, current, locally relevant cost data
    • Technical asset clarity
  4. TECHNOLOGY (Enablement Only)
    • Supports—not replaces—the above

Cost Impact

The impact of effective FM cost management extends beyond cost savings; it can enhance the quality of public infrastructure. For instance, improved maintenance practices can lead to longer-lasting buildings and facilities, ensuring that public assets serve communities effectively for years to come.

When properly implemented:

  • 30–40%+ cost reduction achievable
  • Improved capital allocation
  • Reduced deferred maintenance
  • Better environmental performance

Key mechanism:

Eliminate poor information → Enable good decisions → Standardize execution

To summarize, the integration of effective FM Cost Management strategies not only minimizes costs but also contributes to the overall resilience and sustainability of public sector organizations, ensuring they can meet current and future demands efficiently.

By focusing on eliminating poor information and enabling good decisions, stakeholders can ensure that each phase of the project lifecycle is executed with precision. This disciplined approach will support better environmental performance, which is increasingly important in today’s climate-conscious society.

Four BT, LLC (4BT) provides cost data intelligence solutions for the built environment. Learn more…

← Back

Thank you for your response. ✨

Fire Protection Inspections – Federal Sector Common Mistakes

A very common contracting mistake occurs when federal agencies require NICET-certified fire protection inspections but structure the contract in a way that unintentionally triggers the Davis–Bacon Act rather than the Service Contract Act. This happens frequently in contracts issued by agencies such as the U.S. Department of Veterans Affairs, the U.S. Department of Defense,  the General Services Administration, and others.


The Contracting Mistake – Fire Protection Inspections

Many agencies write inspection contracts that require contractors to:

  • Perform NFPA-required testing

  • Repair deficiencies discovered during inspection

  • Replace minor components

  • Adjust system devices

  • Perform troubleshooting

At the same time, the contract is classified as a service contract under the Service Contract Act and uses technician wage categories.

This creates a legal problem.

Once the contract requires repair or alteration of a building system, it can fall under the Davis-Bacon Act, which governs construction labor.

Fire Protection Inspections


4BT exclusively provides verifiable, current, granular and standardized cost data for both SCA service activities and construction (repair, renovation, corrective maintenance…)


Why NFPA testing triggers the issue

Standards from the National Fire Protection Association often require technicians to physically manipulate or activate systems during testing, such as:

Fire Alarm Systems (NFPA 72)

  • Activate pull stations

  • Remove detectors for testing

  • Test notification circuits

  • Replace devices

Sprinkler Systems (NFPA 25)

  • Trip waterflow switches

  • Exercise control valves

  • Replace sprinkler heads

  • Test supervisory devices

These tasks involve mechanical or electrical work on building systems, which the U.S. Department of Labor may classify as repair or alteration work under Davis-Bacon.


The payroll conflict that results

When agencies misclassify the contract:

Contract Assumption What the law may require
Engineering Technician (SCA wage) Electrician (DBA wage)
Fire Protection Technician Sprinkler Fitter (DBA wage)

The difference can be $20–$40 per hour per worker.

If audited, the contractor could be required to pay back wages for every hour worked.


The second mistake agencies make

Another frequent error is combining inspection, testing, and repair in a single contract line item.

For example:

“Contractor shall inspect, test, maintain, and repair fire alarm systems.”

This language mixes service work and construction work in the same scope.

The U.S. Department of Labor often views such contracts as construction contracts, meaning Davis-Bacon applies to the labor.


Best practice used by well-run federal contracts

Experienced contracting offices separate the work into two contracts:

Contract 1 — Inspection and testing

  • Visual inspections

  • Documentation

  • Reporting deficiencies

Usually covered under the Service Contract Act.

Contract 2 — Repairs and system modifications

  • Device replacement

  • Wiring repairs

  • Valve replacements

  • System alterations

Covered under the Davis-Bacon Act.

This separation avoids wage law conflicts.


Why this matters financially

If an agency incorrectly classifies the contract and the U.S. Department of Labor investigates, the contractor may face:

  • 3 years of back wages

  • Contract withholding

  • Liquidated damages

  • Possible debarment from federal contracts


Bottom line

Requiring NICET certification does not determine the wage classification.

Under federal labor law, the key question remains:

Is the worker performing construction-type work on the building system?

If the answer is yes, the Davis-Bacon Act likely applies, regardless of the contract title or technician certification.

Note:  The author nor Four BT, LLC is providing any form of legal advice.  Readers should contact appropriate legal representation.

← Back

Thank you for your response. ✨

The 4 Horsemen of AECOO Project Failure

The 4 Horsemen of AECOO Project Failure

In the realm of construction and engineering, understanding the key factors that contribute to project failure is crucial. The term ‘AECOO’ represents the Architecture, Engineering, Construction, Owner, and Operations sectors, which are inherently interconnected. When any part of this ecosystem fails, the entire project is at risk. This article will delve into the nuances of these failures, providing insights and examples to illustrate the importance of a robust project framework.

project failure

If you want to know why projects fail, don’t start with the contractor—start with the Scope of Work.

The Scope of Work (SOW) serves as the foundation of any project. A well-defined SOW outlines the project’s objectives, deliverables, and timelines. For example, consider a construction project aiming to build a new office complex. If the SOW lacks clarity regarding the materials to be used or the timeline for completion, it sets the stage for misunderstandings and conflicts. Ensuring that all stakeholders have a clear understanding of the SOW can mitigate risks significantly.

In far too many projects (probably 90%+), the SOW is vague, incomplete, or poorly communicated. From that moment forward the project is running on chaos.

Projects can suffer because stakeholders often assume they understand the SOW without having it documented comprehensively. A case study of a high-rise building project reveals that miscommunication led to unexpected design changes halfway through construction, resulting in increased costs and extended timelines. Thus, effective communication and documentation are paramount to ensuring that the SOW serves its purpose.

Four things almost always show up together:

The presence of a weak SOW indicates deeper issues within project management. Effective project management includes regular reviews of the SOW to ensure it aligns with the project’s progress. For instance, if stakeholders fail to revisit the SOW during the construction phase, they may overlook critical adjustments needed due to unforeseen circumstances, leading to costly delays.

  • Weak Scope of Work

  • Ineffective Owner Leadership

    Effective owner leadership is crucial for guiding the project toward success. An owner who is engaged and proactive can steer the project through challenges. For instance, in a recent infrastructure project, strong leadership from the owner led to timely decision-making that prevented several potential delays, demonstrating how vital leadership is in navigating the complexities of construction.

  • No Disciplined Project Process

    The absence of a disciplined project process can lead to chaos. A standardized project management methodology ensures that all team members are on the same page. For example, implementing Agile methodologies in construction project management can enhance flexibility and responsiveness to changes, thereby minimizing the likelihood of project failure.

  • No Local, Current, Verifiable Cost Data

    Having local, current, and verifiable cost data is essential for accurate budgeting. Projects that rely on outdated cost estimates often encounter budget overruns. For instance, a renovation project that used historical data for labor costs misestimated the budget, leading to increased expenses that could have been avoided with updated information.

Those are the Four Horsemen of the AECOO Apocalypse.

Addressing these four horsemen requires a comprehensive approach. It involves continuous education for all stakeholders, investment in project management tools, and fostering a culture of open communication. By tackling these issues head-on, project teams can significantly reduce the likelihood of project failure.

When they ride into a project, the outcome is predictable:
delays, change orders, cost overruns, and finger-pointing.

Delays are often compounded by the lack of clear communication between parties. For example, when architects and contractors are not aligned, it can lead to misinterpretations of project plans, resulting in costly rework. Establishing regular meetings and updates can help mitigate these issues.

The uncomfortable truth:
Most project problems aren’t construction problems.

Recognizing that most project problems stem from leadership and definition issues rather than construction itself can shift the focus toward preventive strategies. Training sessions focused on leadership skills for project managers can enhance their ability to lead teams effectively through challenges.

They’re definition and leadership problems.

Ultimately, acknowledging and addressing the underlying issues of project failure can lead to successful project outcomes. By cultivating a culture that prioritizes clear communication, effective leadership, and disciplined processes, the AECOO industry can move towards reducing the frequency of project failure.

To further illustrate the impact of these ‘Four Horsemen of the AECOO Apocalypse,’ consider a project that faced significant setbacks due to poor scope definition. By investing time in crafting a detailed and clear SOW, the project could have avoided numerous pitfalls, demonstrating the critical nature of proper project planning.


Solve the problem!


← Back

Thank you for your response. ✨


Understanding the Importance of Localized Cost Data

localized cost data
The primary reasons locally researched cost data (e.g., 4BT OpenCOST) is superior to localized cost data (e.g., RSMeans, BNI….) in this specific situation include:

Understanding the Importance of Localized Cost Data

In today’s construction landscape, the importance of accurate cost estimation cannot be overstated. This is especially true when considering the myriad factors that influence construction costs, such as regional economic conditions, labor availability, and material costs. By leveraging localized cost data, construction professionals can enhance their decision-making processes, ultimately leading to more efficient project delivery.

    • Failure of Location Factors: Traditional databases like use a “National Average” baseline and apply a City Cost Index (CCI) or broad localization and economic multipliers to adjust costs for specific areas. These multipliers often fail to capture specific local material  or labor variations, potentially introducing errors of 30% to 40%+ in definitive estimates.

For instance, consider a construction project in a rural area versus an urban center. The cost of labor may vary significantly between these locations due to demand and availability. In urban centers, labor may be more expensive due to higher living costs, while rural areas may have a surplus of available labor, driving costs down. Understanding these nuances through localized cost data can prevent significant budget overruns.


    • Manual Sourcing vs. Primary Research: While teams using traditional software often find themselves manually sourcing prices to validate bids, 4BT avoids factoring entirely by exclusively providing locally researched unit price datasets built from the ground up based upon client requirements.

Moreover, the reliability of manual sourcing can vary greatly. In one scenario, a contractor might rely on outdated pricing gathered from a previous project, leading to inaccuracies in their bids. In contrast, using primary research methodologies to gather current local prices can help ensure that bids reflect true market conditions, thus improving the chances of successful project execution.


    • Precision in Bulk Materials: Research has shown that localized multipliers can significantly miss the mark for  materials; for example, concrete has been found to be underestimated by 18% when relying on adjusted national averages rather than primary-source local data.

This necessity for accuracy extends beyond just material costs. For example, when evaluating equipment rental prices, localized cost data can highlight not just the base rate for equipment but also the availability and associated delivery fees, which can vary widely from one region to another. Such comprehensive cost insights are essential for accurate budgeting and scheduling.


    • Audit-Defensible Accuracy: Locally researched data provides a higher level of cost visibility and transparency, making it suitable for “Class 1” definitive  estimates required for procurement, whereas factored data is typically recommended only for early-stage conceptual “go/no-go” analysis.

Furthermore, the implications of using factored data can lead to misaligned project expectations. For instance, if project stakeholders assume that the traditional methods of cost estimation will yield reliable results, they may find themselves facing unexpected financial hurdles when actual costs emerge. This underscores the need for meticulous cost planning using localized cost data.


References:

AACE International. (2020). Cost Estimate Classification System – As Applied in Engineering, Procurement, and Construction for the Process Industries. [Online] Available at: AACE.org [Accessed 2 Mar. 2026]. (Note: Validates that Class 1 estimates require detailed unit-costing rather than factored methods.)

ASCE. (2017). ‘Estimating Location-Adjustment Factors for Conceptual Cost Estimating: Use of Nighttime Light Satellite Imagery’, Journal of Construction Engineering and Management, 143(8). Available at: ASCE Library [Accessed 2 Mar. 2026]. (Note: Demonstrates that current proximity-based location factors can have a 25–40% error margin.)

Estes, J. (2016). A Comparison of Construction Cost Estimating Sources. Baton Rouge: Louisiana State University. 

Martinez, A. (2010). Validation of methods for adjusting construction cost estimates by project location. Albuquerque: University of New Mexico UNM Digital Repository. Available at: UNM Digital Repository [Accessed 2 Mar. 2026].

MDPI. (2022). ‘Mapping Construction Costs at the National Level’, CivilEng, 3(1), pp. 111-125. Available at: MDPI.com [Accessed 2 Mar. 2026]. (Note: Highlights that the RSMeans CCI does not account for local labor productivity or unique building codes.)

Peitlock, B.A. (1998). ‘Developing Location Factors Using a Factoring Method’, International Cost Management Journal, International Cost Engineering Council. (Note: The foundational research stating factors are only for conceptual “go/no-go” analysis.)

RSMeans. (2025). How Does Location Affect the Cost of Construction Projects? [Online] Available at: RSMeans.com [Accessed 2 Mar. 2026]. (Note: Acknowledges that location-specific factors like climate and local regulations can cause costs to vary by over 38% between cities.)

In addition, it is vital to note how other external factors, such as seasonal changes and economic shifts, can affect construction costs. For instance, the cost of materials may rise significantly during peak construction season due to increased demand. Localized cost data can provide insights into these fluctuations, allowing project managers to time their purchases strategically.

SMACNA. (2025). Union Labor Costs In Construction 2025. [Online] Available at: SMACNA.org [Accessed 2 Mar. 2026]. (Note: Shows that local labor rates can vary by up to 21% from the U.S. average.)

Lastly, understanding the unique regulations and building codes in a specific geographic area can impact construction costs significantly. Localized cost data can help construction professionals stay informed about any changes in these regulations, which could affect permitting and operational costs.

In summary, utilizing localized cost data not only improves cost estimation accuracy but also enhances overall project delivery efficiency. As construction projects become more complex and the market becomes more competitive, relying on precise, localized information will be crucial for success.

← Back

Thank you for your response. ✨

Note:  All trademarks and rights remain solely with their respective owners and no endorsements of any kind are given or implied.

FM Cost Imperative

When will the FM Cost Imperative for cost management become a reality?

FM Cost Imperative

Economic volatility is here to say, and escalating operating costs and budget constraints the norm.

While streamlining supply chains and developing long-term partnerships based upon mutual benefit remain critical, it’s impossible to manage what is not measured.

Objective, current, granular, standardized, LOCALLY RESEARCHED cost data for repair, renovation, maintenance, and new builds is a requirement for achieving cost visibility and enabling true COST MANAGEMENT.

The FM Cost Imperative emphasizes the need for effective strategies to manage costs in construction.


Full Article

When Will the FM Cost Management Imperative Become a Reality?

Economic volatility is no longer a temporary disruption—it is the operating environment.
Facilities leaders today face escalating labor costs, supply chain disruptions, energy price swings, and tightening budgets. The challenge is no longer simply reducing costs—it is managing costs with precision and foresight.

Yet most organizations are still trying to manage facilities costs with outdated tools, fragmented data, vendor pricing, and national averages that bear little resemblance to local market reality.

Cost management cannot exist without cost visibility.


The New Reality: Cost Volatility Is Structural, Not Cyclical

Facilities management (FM) has entered a permanent era of uncertainty. Labor shortages, inflationary pressures, energy volatility, and supply chain disruptions are reshaping operating cost profiles across portfolios.

Industry research confirms that macroeconomic factors significantly affect building operations, services, and maintenance costs—making accurate, timely cost intelligence essential for budgeting and planning.

However, most FM organizations still rely on historical pricing, cost averages, indexed databases, or national benchmarks adjusted with location factors. These approaches obscure real market conditions and delay actionable decisions.


You Can’t Manage What You Don’t Measure

The FM industry has long acknowledged a fundamental truth:

Cost management requires measurement, and measurement requires data architecture.

Granular, categorized cost data enables portfolio benchmarking (e.g., cost per square foot, cost per occupant), trend analysis, and optimization strategies—capabilities that are impossible without structured data integration.

Yet many organizations still lack:

  • Objective and verifiable cost components

  • Current local labor, material, and equipment pricing

  • Standardized data structures

  • Line-item-level cost transparency


Why Local, Granular, Standardized Cost Data Is the Missing Link

True cost management demands locally researched, standardized, line-item data for:

  • Repair and maintenance

  • Renovation and recapitalization

  • Capital construction

  • Lifecycle asset planning

4BT’s framework emphasizes that standardized local market cost data dramatically improves cost visibility and decision quality—far beyond national averages or indexed estimates.

Without this level of detail:

  • Owners cannot validate contractor pricing

  • FM teams cannot forecast budgets accurately

  • Procurement cannot benchmark supplier performance

  • Capital planning becomes reactive instead of strategic


The FM Cost Management Imperative: From Visibility to Control

Cost management maturity follows a predictable progression:

  1. Cost Awareness – Reactive spending and anecdotal benchmarks

  2. Cost Visibility – Granular standardized data and dashboards

  3. Cost Control – Procurement optimization and scope governance

  4. Cost Optimization – Predictive analytics and scenario modeling

  5. Cost Management – Strategic lifecycle financial governance

Most organizations remain stuck between Levels 1 and 2.

The imperative is to move directly to Level 4 and beyond.


From Data to Decision Advantage

When organizations adopt granular, standardized, locally researched cost data, they unlock:

  • Accurate budgeting and forecasting

  • Supplier performance benchmarking

  • Real-time scope and cost trade-off decisions

  • Integrated project delivery optimization

  • Lifecycle cost minimization

In short: They transform FM from a cost center into a financial intelligence engine.


When Will the FM Cost Management Imperative Become Reality?

The imperative becomes reality when organizations stop asking for better dashboards and start demanding better data.

Facilities cost management is not a software problem.
It is a data architecture and governance problem.

4BT is building the infrastructure to make cost management real—by delivering objective, current, granular, standardized, locally researched cost intelligence across the built environment lifecycle.

The future of FM belongs to organizations that measure everything—and manage what matters.

4BT Thought Leadership – www.4bt.us: We help to create environments where the best people come to do their best work. Join us as we pave the way toward a new future for public and private sector efficient project delivery.

  • Estimate project costs comprehensively – Ensure budgets reflect the actual current local market labor, material, and equipment costs for successful project delivery.
  • Create detailed and realistic project timelines – Identify key milestones, task dependencies, and critical paths.
  • Minimize risks associated with delays and budget overruns – Provide a clear project roadmap and cost control mechanisms.
  • Enhance resource allocation and utilization – Align resources and scheduling with budget constraints.

Transitioning managed JOC Programs

Transitioning managed JOC Programs (e.g. Gordian) to an “Open JOC” model (like 4BT) invovles shifting from a volume-based “percentage fee” consultant model to an owner-managed program supported by transparent data and software.

Transitioning managed JOC Programs4bt.us

Transitioning managed JOC Programs involves a multifaceted approach that requires careful planning and execution. In this section, we will explore the various strategies that organizations can employ to ensure a smooth transition. Examples of successful transitions will also be discussed, highlighting key factors that contributed to their success.

Transition Strategy & Best Practices

Understanding the transition strategy is crucial for organizations aiming to optimize their project delivery through managed JOC Programs. This strategy must include a well-defined roadmap that outlines the steps and best practices necessary for a successful implementation. By examining case studies of organizations that have effectively transitioned, we can gain valuable insights into the common pitfalls and effective solutions.

    1. Contract Audit and Termination: Review your current Gordian agreement for termination-for-convenience clauses. Note that if you are using Gordian’s proprietary Construction Task Catalog (CTC), you may not be able to use that data for all prior purposes once the contract ends.

Contract audits are not merely a formality; they can reveal hidden costs and inefficiencies within existing contracts. For instance, a thorough review may uncover outdated clauses that no longer serve the organization’s interests, thus providing grounds for renegotiation or termination. Organizations should document these findings to inform future contract strategies.

    1. Establish an Independent Unit Price Book (UPB): Move away from construction task catalogs to a locally researched UPB. 4BT OpenCOST provides objective, verifiable, local labor, material, and equipment rates that do not rely on national averages or location factors.  Data is organized by expanded CSI Masterformat.

Establishing an Independent Unit Price Book (UPB) can significantly improve cost management in JOC Programs. This UPB should be tailored to reflect local market conditions, which can vary widely even within short geographical distances. For example, a construction project in an urban area may require different pricing structures than one in a rural setting due to labor availability and material costs.

    1. Adopt a SaaS/Flat-Fee Software Model: Select a JOC management platform that charges a flat annual fee or SaaS subscription rather than a percentage of construction volume. This decouples the provider’s revenue from your project costs, eliminating the incentive for “scope creep.”

The adoption of a SaaS/Flat-Fee Software Model can also play a pivotal role in managing project costs effectively. This model allows organizations to predict their software expenses accurately, removing the uncertainty associated with fluctuating project volumes. By avoiding percentage-based fees, organizations can allocate more resources to essential areas such as quality control and project management.

    1. Update Procurement Documents: Your new RFP must define the new UPB and software requirements. Ensure it specifies that contractors will bid Adjustment Factors against the new, locally-researched price guide.

Updating procurement documents is a vital step that sets the stage for successful bidding. These documents should clearly articulate the expectations and requirements based on the new UPB. For instance, specifying that contractors will bid against the local price guide will create a level playing field and promote competitive pricing.

    1. Internal Capacity Building: Since you will be moving from a managed service to an owner-led model, focus on training your facilities and procurement staff on JOC best practices, such as validating that line items match the scope of work. Department of Enterprise Services (DES) (.gov)Department of Enterprise Services (DES) 

Internal capacity building cannot be overlooked during this transition. Training programs should focus on developing the skills necessary for staff to manage JOC contracts effectively. This includes understanding pricing strategies, project management principles, and best practices for contractor evaluation.

As organizations transition to 4BT, they must also consider how this change affects their strategic goals. Aligning the transition process with the organization’s long-term vision can help ensure that all team members are working towards a common objective, which contributes to smoother implementation.

Why Organizations Transition to 4BT and the Importance of a Structured Approach

When analyzing why organizations choose to transition to 4BT, it’s essential to consider the long-term benefits that can arise from this shift. Beyond immediate cost savings, organizations often find that their overall project delivery timelines improve significantly, leading to enhanced satisfaction among stakeholders.

    • Cost Savings: Avoiding Gordian’s 2%–5%+ administrative fee on every project can save hundreds of thousands of dollars in large programs.

Cost savings extend beyond mere administrative fees. By analyzing project expenditures holistically, organizations can identify areas where operational efficiencies can be realized. For instance, re-evaluating supplier contracts and renegotiating terms can lead to substantial discounts.

    • Data Accuracy: Replacing location-factored data with locally researched market rates reduces the error rate associated with national average databases and associated location factoring (e.g. RSMeans, BNI…)

Data accuracy is paramount in any construction project. By using local market rates, organizations can minimize discrepancies that often arise from national averages. This accuracy not only helps in budgeting but also ensures that stakeholder expectations are managed effectively.

  • Auditability: Standardized, cloud-based workflows ensure every job order is fully documented, reducing the risks of fraud highlighted in independent audits of legacy programs.
    Transitioning managed JOC Programs4bt.us 

    In conclusion, transitioning managed JOC Programs is a comprehensive process that requires careful planning, execution, and ongoing assessment. Organizations that take the time to understand the implications of these changes and invest in training and development will be better positioned to reap the benefits of improved project delivery and cost efficiency.

NOTE:  All trademarks and rights remain solely with their respective owners.  No endorsements of any kind are given or implied.

JOC SABER IDIQ Training

JOC SABER IDIQ TrainingJOC SABER IDIQ Training – Sample Course Syllabus: Detailed Line Item Estimating with Objective Local Cost Data


JOC SABER IDIQ Training – Detailed Line Item Estimating with Objective Local Cost Data

Module Topic Key Learning Outcomes
1.0 Estimating Foundations: Cost vs. Price
1.1 The Estimator’s Role Defining scope, WBS, and CES; the responsibility of the estimator to determine cost.
1.2 Differentiating Cost vs. Price Understanding that quotes include margin, risk perception, and market strategy; distinguishing objective cost modeling from relying on subjective bids.
1.3 Basis of Estimate (BOE) Learn to document all assumptions, data granularity, and calculation methods.
Module Topic Key Learning Outcomes
2.0 Quantity Takeoff (QTO) & Scope Definition
2.1 QTO Techniques & Tools Master methods for measuring quantities accurately from detailed design documents.
2.2 Scope Alignment Ensuring QTO granularity matches the required level of detail for a line-item cost database input.
2.3 Review & Validation Performing internal checks on quantities as the foundation of cost accuracy.


Module Topic Key Learning Outcomes
3.0 Sourcing and Building the Objective Local Database
3.1 Limitations of Averages Analyze why national sources (RSMeans, BNI) and subcontractor prices are inadequate as primary objective cost data. Learn how a system like 4BT aims to address these limitations through local research.
3.2 Sourcing Raw Local Data Identify and vet raw data inputs: material spec sheets, fuel costs, local insurance rates, prevailing wage data, and local union agreements.
3.3 Database Management Principles of populating and maintaining a current, objective, granular cost database for consistent estimating.
3.4 Indexing and Verification Using location indices only as a macro-level sanity check for the built-up local data.
Module Topic Key Learning Outcomes
4.0 Calculating True Unit Costs
4.1 Material Unit Costs Determine raw material FOB costs, local taxes, and precise delivery fees based on verifiable supplier invoices or price lists.
4.2 Labor Cost Buildup Calculate fully burdened costs (base wage, fringe benefits, insurance, payroll taxes) using local regulatory data, not advertised “rates.”
4.3 Equipment Ownership & Operating Costs Determine true ownership, operating (fuel, maintenance), and rental costs from objective financial data.
4.4 Productivity & Crew Buildup Integrate local, verifiable productivity factors and build composite crews with calculated all-in hourly costs.


Module Topic Key Learning Outcomes
5.0 Assembly, Risk, and Validation
5.1 Estimate Compilation Organize all line items within the WBS/CES hierarchy, using calculated unit costs (potentially utilizing software from vendors like 4BT).
5.2 Validating Against Market Price Comparing the objective cost estimate to received subcontractor prices to identify risk premiums or negotiation points.
5.3 Contingency and Risk Quantify and include specific project contingencies based on gaps in objective data coverage.
5.4 Final Reporting Assemble the final estimate package, emphasizing the objective nature of the cost basis in the BOE narrative.

Note:  All trademarks and rights remain with their respective owners, and no endorsements of any kind are given or implied.


← Back

Thank you for your response. ✨

High Performance JOC

High Performance JOC = easy-to-use JOC Software with unparalleled support services, verifiable local market cost data, delivering the highest value to everyone.  It’s that simple.

  1. When done right, JOC becomes a platform for:
  2. Verifiable cost control
  3. Predictable, transparent pricing
  4. Faster project completion
  5. Reduced change orders and disputes
  6. Strong, sustained owner–contractor partnerships

high performance JOC

← Back

Thank you for your response. ✨

2026 Construction Cost Data – Verfiable, Objective, Granular, LOCALLY RESEACHED, CSI Masterformat

2026 Construction Cost Data –

In the rapidly evolving landscape of construction management, having access to reliable cost data is crucial for stakeholders from contractors to project managers. The 2026 Construction Cost Data provides a comprehensive view of the current market trends, allowing for better budgeting and planning.

  • Verifiable
  • Provides insights into the latest construction techniques, which can lead to cost savings and efficiency improvements.
  • Locally researched (No error introducing location factor or economic indexes)
  • Granular line item construction tasks
  • Crews and productivity using CURRENT commercial construction means and methods
  • Full descriptions
  • Detailed descriptions aid in understanding the unique factors that affect construction costs, including labor rates and material availability.
  • Cost totals per unit of measure
  • Labor, material, and equipment cost details
  • Understanding equipment costs is crucial as they can significantly impact the overall budget of a construction project.
  • Local unit price books are updated quarterly
  • Supporting Secure Technology (Microsoft Government Cloud – CMMC Lvl 2 Compliant)
    • Keyword search
    • Utilizes advanced search functionalities to allow users to efficiently find specific cost items related to their projects.
    • Masterformat tree
    • Estimate builder
    • Helps in creating estimates that are tailored to specific project needs, enhancing accuracy and reliability.
    • Work breakdown structures (WBS)
    • Estimate/Bid builder
    • Facilitates the bidding process by providing more accurate cost estimates, which can lead to better project outcomes.
    • Coefficient/Ad-Ons (%, fixed amount)
    • Line item and estimate level notes
    • Allows for comprehensive notes that provide context and rationale for cost decisions, aiding communication among project teams.
    • Custom line-item builder
    • Automatic estimate comparisons
    • Enables detailed comparison of estimates, which can reveal discrepancies and lead to more informed decision-making.
    • Copy/paste/merge estimates
    • Summary and detail level reporting
    • Reporting capabilities can showcase performance metrics, helping stakeholders evaluate project success.
    • Dashboard
    • Status tracking-multiple phases
    • Tracking the status of multiple phases enhances project management and visibility.
    • Automatically update estimates to any price book
    • 90,ooo+ repair, renovation, maintenance, new build line items
    • Offers a comprehensive library of line items that cover a wide range of construction activities, making it easier to estimate costs accurately.
    • Separate preventive maintenance price book – locally researched, costs and check lists for all frequencies-expanded Uniformat data architecture

2026 Construction Cost Data 2026 Construction Cost Data 2 OPencost 2026 Construction Cost Data 1

Construction project managers can leverage the 2026 Construction Cost Data to streamline bidding processes, manage budgets, and ensure compliance with local regulations. Accurate cost data allows for more strategic planning, which is essential for meeting project deadlines and avoiding cost overruns.

References:

#1. – “Location factors are used during preliminary project evaluations. They are not intended to be used when preparing appropriation-quality estimates. They often are applied to conceptual estimates for identifying “go/no-go” projects at an early stage.” (Peitlock, B.A., ccc, Developing Location Factors Using a Factoring Method, International Cost Engineering Council, ICEC International Cost   Management Journal (ICMJ), 1998.)

Moreover, with the trend toward increased transparency in the construction industry, having verifiable data at hand can enhance trust among stakeholders. This trust is pivotal in securing project approvals and financing.

#2. Location factors are primarily used in class 4 and 5 estimates and are not intended to be used for higher quality estimates, such as class 3, 2, or 1. The RSMeans city cost index (CCI) and the Department of Defense area cost factor (ACF) index are two primary examples of location factor publications. (Martinez, A., Validation of methods for adjusting construction cost estimates by project location , University of New Mexico UNM   Digital Repository, 2010)

#3. “Despite its potential weaknesses, estimation by adjustment factors is a very common approach for all types of construction. A very common approach for performing quick-order-of-magnitude estimates is based on using Location Cost Adjustment Factors (LCAFs). The accuracy of cost estimates in the early phases varies within an expected range that spans from -100% to +200% ” “Using the results of this study, various commercial entities (e.g., RS Means) could enhance their online tools by uploading publicly available socio-economic variables and allowing users to perform geostatistical analysis. As a result, a cost engineer could input the location of a project and obtain the most accurate location adjustment factor through a mix of interpolation and geostatistical prediction techniques.” (Migliaccio, G., Empirical Assessment of Spatial Prediction Methods for Location Cost Adjustment Factors, J Constr Eng Manag. 2013)

As construction methods evolve with technology, the integration of real-time data analytics within cost estimation processes is becoming more prevalent. This technology allows for adjustments to be made swiftly, reflecting current market conditions.

#4. “Problems within the methodology, unfortunately, will continue to arise as standardized estimation tools (CCI) simply cannot account for the unique characteristics of individual states.  Unfortunately, the accuracy of program-wide CCIs occasionally led to swings of ±20 percent after projects had gone through the bidding process. Additionally, no direct application of market or economic conditions existed in this conventional CCI process, which was theorized by FHWA to potentially be a significant influence on resulting project estimate accuracy. ”    (University of Colorado Denver College of Engineering and Applied Science Department of Civil Engineering, Validation of Project-level   Construction Cost Index Estimation Methodology, 2017)


In conclusion, utilizing the 2026 Construction Cost Data not only provides clarity and accuracy in cost estimation but also supports overall project success. By investing in accurate and up-to-date cost data, stakeholders can position themselves favorably in a competitive market.

Interested in improving cost visibility and cost management?

← Back

Thank you for your response. ✨


Note:  All trademarks and rights remain solely with their respective owners and no endorsements of any kind are implied or given.

4BT OpenCOST 2026 Construction Cost Data

Construction Cost Certainty

Construction cost certainty can be measurably improved with objective, current, standardized, and granular locally researched construction cost data to enhance Construction Cost Certainty.

Understanding Construction Cost Certainty

Achieving Construction Cost Certainty

It’s critical for real property owners to acknowleged the  limitations of national construction cost databases when used for appropriation-quality, authorization, IGCE, or audit-defensible estimates, and to compare those limitations against the 4BT OpenCOSTTM methodology under FY 2026 market conditions.

Understanding Construction Cost Certainty is vital in today’s construction landscape.

Construction Cost Certainty

Technical Data Sheet — National Cost Databases Vs 4BT OpenCOSTTM (fy 2026)

Technical Data Sheet

Comparison of National Cost Databases (e.g., RSMeans) and 4BT OpenCOSTTM DATA

Document Purpose

To document acknowledged limitations of national construction cost databases when used for appropriation-quality, authorization, IGCE, or audit-defensible estimates, and to compare those limitations against the 4BT OpenCOSTTM methodology under FY 2026 market conditions.

This highlights the importance of achieving Construction Cost Certainty through accurate assessments.

Applicability

  • DOD and non-DOD Federal and other Public Sector construction[1] programs
  • Appropriation and authorization packages
  • Independent Government Cost Estimates (IGCEs)
  • Audit, oversight, and cost validation reviews
  • Guaranteed Maximum Price (GMP) and pre-award budgeting

Data Source Comparison Summary

Attribute National Databases (RSMeans & Similar) 4BT  OpenCOSTTM
Primary Data Basis Aggregated historical national averages Localized, primary-source market data
Intended Use Conceptual planning, benchmarking Appropriation-quality and audit-defensible estimating
Market Timing Periodic publication cycles Near-real-time validation with active markets
Geographic Resolution National averages adjusted by factors Project-specific local pricing
Labor Modeling Standardized productivity assumptions Jurisdiction- and trade-specific labor conditions
Supply Chain Inputs National material indices Supplier-verified availability and pricing
Audit Traceability Limited Full line-item source traceability

Cost Reliability Factors (FY 2026)

National Cost Databases

  • National average unit pricing
  • Achieving Construction Cost Certainty is essential for effective project management.
  • Statistical location and/or economic factors
  • Lagging update cycles
  • User-responsible validation

4BT OpenCOST

  • Direct subcontractor and supplier inputs
  • Market-validated local market labor rates
  • Contractor means-and-methods alignment
  • Transparent cost drivers and assumptions

Acknowledged Limitations vs Mitigations

Cost Risk Category RSMeans Acknowledged Limitation 4BT OpenCOST Mitigation
Market Volatility Not captured Actively validated
Labor Availability Averaged assumptions Local labor market analysis 130+ trades

Implications for Appropriation & Audit

National Databases

  • Increased contingency padding
  • Reduced cost transparency
  • Higher post-award adjustment risk
  • Misalignment with GAO cost estimating best practices

4BT OpenCOST

  • 4BT OpenCOST is designed to improve Construction Cost Certainty in various projects.
  • Reduced contingency reliance
  • Improved cost credibility
  • Enhanced audit defensibility
  • Alignment with GAO standards for documented, credible, and verifiable estimates

Conclusion

National construction cost databases remain useful for early-stage planning and comparative analysis but are not pricing authorities and do not independently support appropriation-quality or audit-defensible estimates in FY 2026.

4BT OpenCOST addresses these limitations through localized, primary-source cost validation, detailed line-item structures, and direct engagement with active market participants—providing a materially higher confidence basis for federal budgeting, authorization, and oversight.

Implementing strategies for Construction Cost Certainty can significantly benefit budgeting processes.

References

Gordian (2024) RSMeans Data Methodology. Greenville, SC: Gordian. Available at: RSMeans Online (Accessed: FY 2026 estimating context).

Gordian (2024) RSMeans Location Factors Overview. Greenville, SC: Gordian. Available at: RSMeans Online (Accessed: FY 2026 estimating context).

Gordian (2024) RSMeans Data Update Cycle and Limitations. Greenville, SC: Gordian. Available at: RSMeans Online (Accessed: FY 2026 estimating context).

Gordian (2024) RSMeans User Notes and Assumptions. Greenville, SC: Gordian. Available at: RSMeans Online (Accessed: FY 2026 estimating context).

Gordian (2024) RSMeans Estimating Assumptions. Greenville, SC: Gordian. Available at: RSMeans Online (Accessed: FY 2026 estimating context).

Gordian (2024) RSMeans Terms of Use. Greenville, SC: Gordian. Available at: RSMeans Online (Accessed: FY 2026 estimating context).

Government Accountability Office (GAO) (2020) GAO Cost Estimating and Assessment Guide: Best Practices for Developing and Managing Capital Program Costs (GAO-20-195G). Washington, DC: U.S. Government Accountability Office.

Government Accountability Office (GAO) (2023) Schedule Assessment Guide: Best Practices for Project Schedules (GAO-16-89G, update). Washington, DC: U.S. Government Accountability Office.

Association for the Advancement of Cost Engineering International (AACE) (2020) Recommended Practice No. 18R-97: Cost Estimate Classification System. Morgantown, WV: AACE International.

All trademarks, logos, and brand names are the property of their respective owners. Use does not imply endorsement or affiliation.

[1] Construction=Repair, Renovation, Maintenance, New Build, SABER, JOC, MATOC, IDIQ


Factored Estimates Are Failing in 2026

Factored Estimates Are Failing in 2026

Why National Averages and Location Multipliers Can No Longer Produce Defensible Construction Budgets

In 2026, relying on national averages, location factors, or generic cost multipliers for appropriation-quality construction budgets is no longer defensible. Accelerating market volatility, regional labor instability, and fragmented supply chains have rendered factored databases structurally incapable of producing estimates that are auditable, verifiable, or aligned with real market conditions.

In addition to the issues mentioned, there are significant repercussions stemming from the reliance on outdated data. For instance, take the case of a mid-sized construction firm in the Midwest that used national average data for a large commercial project. Due to a sudden spike in material costs influenced by global supply chain disruptions, they encountered a shortfall that led to budget overruns exceeding 25%. This scenario underscores the critical importance of utilizing real-time data to adapt to market fluctuations.

This is not a theoretical concern. Post-bid analyses and owner audits consistently show that estimates derived from national databases—adjusted by geographic multipliers—introduce extreme variance. Early-phase errors commonly exceed ±100%, while post-bid reconciliations frequently result in ±40%or greater cost swings. These outcomes are not anomalies; they are a predictable consequence of applying static, averaged data to highly localized and rapidly shifting markets.


Why Generic Cost Factors Fail

The failure is methodological, not procedural.

Most national cost databases are updated quarterly at best and often annually. They cannot capture real-time local disruptions such as supplier insolvencies, material allocation constraints, sudden labor shortages, or trade-specific productivity losses. Broad location factors also fail to model site-specific realities—urban access constraints, jurisdictional building code mandates, seismic or hurricane requirements, or local union work rules.

Moreover, the impact of local regulations cannot be overstated. In many regions, specific building codes and environmental regulations can add significant costs to a project. For instance, a construction project in California had to incorporate extensive seismic safety measures due to local legislation, leading to a cost increase of 20%. This exemplifies how regional policies directly affect construction expenses, further illustrating the limitations of national averages.

As a result, generic estimates embed systemic uncertainty. Contractors respond by inflating contingencies, owners absorb unnecessary cost buffers, and projects experience avoidable change orders once actual market pricing replaces assumptions.

What Appropriation-Grade Estimating Requires in 2026

Defensible estimating in 2026 requires a shift from secondary indices to localized, primary-source cost data supported by detailed line-item structures.

In this evolving landscape, it’s essential to engage in continuous learning and adaptation. Companies that invest in training their estimating teams to utilize advanced cost estimation software can improve accuracy and responsiveness. Such software often integrates local market data, allowing estimators to generate more precise bids that reflect current conditions, thus minimizing risks associated with outdated information.

High-fidelity estimates are now built by:

  • Integrating current material pricing directly from local suppliers

    Furthermore, collaboration with local suppliers can significantly enhance pricing accuracy. When contractors build relationships with local material suppliers, they gain insights into upcoming price changes and availability issues. For instance, a contractor in a construction boom town managed to secure materials at pre-inflation rates by forging strong partnerships, which greatly aided in maintaining competitive pricing on their projects.

  • Soliciting and validating real subcontractor quotes to confirm labor availability and “street pricing”

  • Anchoring quantities to BIM models tied to firm-verified local cost libraries

    Adopting Building Information Modeling (BIM) not only helps in visualizing the project but also supports accurate cost estimation. For instance, a leading construction firm that utilized BIM saw a reduction in change orders by 30% due to improved accuracy in quantity takeoffs and better collaboration among project stakeholders. This model significantly enhances communication, allowing all parties to stay aligned with project specifications.

  • Benchmarking directly against union wage agreements and commerical productivity data

Emerging alternatives to factored datasets—particularly those organized around expanded CSI MasterFormat structures with tens of thousands of detailed line items—explicitly reject national averages. Instead, they rely on locally researched unit pricing, transparent labor-material-equipment breakdowns, and frequent updates that reflect actual market movement rather than smoothed historical trends.

Why This Shift Is No Longer Optional

Detailed, localized estimating is increasingly mandated in high-performance delivery models such as Job Order Contracting (JOC) and Integrated Project Delivery (IPD), where auditability and cost transparency are contractual requirements.

As the construction landscape evolves, embracing innovative management strategies becomes essential. For example, implementing Integrated Project Delivery (IPD) can lead to improved collaboration among all parties involved, resulting in more accurate cost-sharing and risk distribution. A recent project employing IPD saw a 40% reduction in overruns, showcasing the benefits of this approach in today’s market.

The financial impact is decisive. Owners that transition from factored national databases to localized, primary-source cost data routinely reduce total project costs by 30–40%—not by cutting scope or quality, but by eliminating the uncertainty premiums embedded in generic estimates.

In 2026, detailed line-item estimating grounded in local market reality is not an innovation. It is the minimum standard for credibility. Anything less is a high-risk approximation masquerading as precision.

Looking ahead, the construction industry must remain agile and responsive to change. By focusing on robust, data-driven estimating processes, construction firms will not only enhance their competitive edge but also ensure the delivery of high-quality projects that meet client expectations in a timely manner. Such a proactive approach is vital in navigating the complexities of modern construction environments.


References

AECOM (2024) Construction Cost Handbook: Market Volatility and Regional Risk. London: AECOM.

Association for the Advancement of Cost Engineering (AACE) (2023) Cost Estimate Classification System – As Applied in Engineering, Procurement, and Construction. Morgantown, WV: AACE International.

Bechtel (2023) Lessons Learned in Early-Stage Cost Estimating. Reston, VA: Bechtel Corporation.

Construction Industry Institute (CII) (2022) Improving Early Cost Estimate Accuracy. Austin, TX: University of Texas at Austin.

Gould, F.E. and Joyce, N.E. (2019) Construction Project Management. 4th edn. Boston, MA: Pearson.

RSMeans (2024) Data Methodology and Limitations Statement. Norwell, MA: Gordian.

U.S. Army Corps of Engineers (2023) Job Order Contracting Desk Guide. Washington, DC: USACE.

Winch, G.M. (2010) Managing Construction Projects. 2nd edn. Oxford: Wiley-Blackwell.

Many cost estimating professionals note that relying solely on national cost books (e.g., RSMeans Gordian, BNI…etc.) and simple location factors often isn’t enough for accurate, procurement-ready budgeting — especially in volatile local markets.  4BT positions its OpenCOST™ data specifically to address that gap with current granular, locally researched information.


Note:  All trademarks, logos, and brand names are the property of their respective owners. Their use does not imply endorsement, affiliation, or any relationship with the mark’s owner.

← Back

Thank you for your response. ✨

About Four BT, LLC (4BT) – We help to create environments where the best people come to do their best work. We all succeed together.

Join us as we pave the way toward a new future for public and private sector efficient project delivery.

4BT exclusively provides verifiable, objective, current, local market construction cost data organized using expanded CSI Masterformat and supporting technology.

-Estimate project costs comprehensively

-Ensure budgets reflect the actual current local market labor, material, and equipment costs for successful project delivery.

-Create detailed and realistic project timelines

-Identify key milestones, task dependencies, and critical paths.

-Minimize risks associated with delays and budget overruns

-Provide a clear project roadmap and cost control mechanisms.

-Enhance resource allocation and utilization

-Align resources and scheduling with budget constraints.

Standardized Cost Data

Standardized Cost Data, while often overlooked, is critical to the consistent attainment of construction / FM projects on-time, on-budget, and per requirements.

Understanding the significance of Standardized Cost Data is essential for estimators, project managers and stakeholders alike. This data serves as a foundation for accurate budgeting, forecasting, and overall financial management in construction projects. When properly utilized, it can lead to significant cost savings and improved project outcomes by providing transparency and consistency in estimating project costs. For instance, by relying on standardized data, project managers can make more informed decisions, reducing the likelihood of unexpected expenses and delays during the project lifecycle.


What are the key components of Standardized Cost Data? Understanding these components is vital for effective cost management in construction projects. Each element contributes to a comprehensive view of project expenses, ensuring that all stakeholders are aligned on budget expectations and financial planning.

  • Expanded CSI Masterformat: The Construction Specifications Institute (CSI) Masterformat is a standardized classification system that organizes construction-related information. By expanding this format, project teams can enhance clarity and consistency in their documentation, allowing for easier navigation and understanding of project specifications.


  • Locally researched labor, material, and equipment costs (No use of location factors, national average cost data, economic indexes.): Accurate local data ensures that estimates are reflective of the actual costs faced in a specific area. This approach minimizes discrepancies and provides a realistic financial picture for project stakeholders.


  • Granular line-item construction tasks: Breaking down costs into granular line items allows for detailed tracking and management of expenses. This level of detail supports better project oversight and accountability, enabling teams to pinpoint areas where cost savings can be realized.


  • Clear descriptions written in plain English without acronyms/abbreviations: Clarity in documentation is crucial for ensuring all team members understand project requirements and expectations. Using straightforward language helps in minimizing miscommunication and errors during project execution.


  • Associated with current commercial construction means and methods: Staying up-to-date with construction techniques and methodologies ensures that cost data remains relevant and applicable. This alignment allows for more accurate budgeting and project execution based on the latest industry practices.


  • Timeliness (Updated quarterly at a minimum): Regular updates to cost data are essential for maintaining accuracy in estimates. By updating data quarterly, project teams can account for fluctuations in material prices, labor rates, and other economic factors that influence project costs.


  • Enabling cloud technology: The 4BT Benchmark Construction Estimator™ combined with 4BT current and actionable local market construction cost data enables robust cost estimate creation, updating, sharing, and downloading with the highest possible degreeof cost visibility.
  • Standardized Cost Data

Four BT, LLC (4BT) is the exclusive source of objective, current, granular, locally researched cost data organized using CSI Masterformat, comprised of 90,000+ line items and updated quarterly. This extensive repository of standardized cost data serves as a valuable resource for construction professionals, helping them to make informed decisions and improve project outcomes. By leveraging this data, businesses can enhance their competitive edge and ensure that their financial planning is grounded in reliable information. The ability to access such detailed cost data empowers project managers to develop more accurate estimates, streamline procurement processes, and ultimately deliver projects that meet client expectations.

  • What it measures: The current COST for thousands of repair, renovation, maintenance, or new build costs for YOUR LOCATION without contractor overhead and profit. This direct measurement enables stakeholders to understand the true costs involved in their projects, facilitating better budgeting and planning.


  • Why it matters: How can you manage costs without cost visibility? You cannot. Owners and design-builders can now quickly and objectively determine construction/FM related costs. By utilizing Standardized Cost Data, they can identify potential financial pitfalls early in the project lifecycle, enabling proactive management and adjustments to keep projects on track and within budget.


  • Where to start improvements: Establish a policy and standardized rule-based workflows for estimating and managing projects so everyone consistently leverages cost data. Ensure Planning, Procurement, and Project Delivery teams are involved on an early and ongoing basis. Engaging all relevant stakeholders in the process fosters a culture of collaboration and accountability, leading to improved project efficiencies and outcomes.


← Back

Thank you for your response. ✨


Download a Comprehensive Review of Construction Cost Data Providers (Download)

Download GAO Guide to Cost Estimating (Download)

Improved construction outcomes

Improved construction outcomes don’t happen because of more tools, but because of great teams, robust processes, actionable data, and competent, supportive, and accountable leadership.

Integrating  and empowering Planning, Procurement, and Project Delivery Teams within a proven operational framework can turn wasteful practices into efficient lifecycle management of the built environment.

Improved construction outcomes

By enhancing the operational efficiency you get a number of advantages, less time spent on repetitive tasks, lower costs. stronger partnerships. And on-time, on-budget, and quality projects.

Focus upon PRECONSTRUCTION relative to all related aspects of Planning, Procurement, and Project Delivery phases delivers the highest value.

Key Concepts Explained:

Prioritizing early, collaborative planning and using verifiable, locally researched and standardized granular construction task cost data in preconstruction leads to superior project outcomes (on-time, on-budget, better value) for facility repairs, renovations, maintenance and new builds. By integrating people, processes (like collaborative Job Order Contracting and Integrated Project Delivery), and secure technology for transparency and shared goals, organizations like Four BT, LLC (4BT) help real property owners and their services partners avoid costly redesigns and achieve better results, maximizing investment in the critical upfront stages.


  • 4BT:  A company providing objective, verifiable and standardized locally researched construction cost data, cloud technology, and support services, emphasizing LEAN, integrated project delivery (IPD), and data-driven decision-making.
  • Preconstruction Focus: Emphasizes that thorough planning, accurate estimating with local data (vs. sole reliance on “market average” cost data or contractor quotes), and early collaboration (not just cost-cutting) during the initial phase yields the best overall project value.
  • Highest Value: Achieved through cost certainty, reduced waste, improved quality, faster delivery, and greater stakeholder satisfaction, moving beyond just the lowest initial bid.
  • How it Works (4BT Approach):
    • Data-Driven Decisions: Uses highly developed, verifiable cost data (labor, materials, equipment) for realistic budgeting.
    • Integrated Delivery: Combines owner, designer, and contractor in collaborative models like IPD and collaborative Job Order Contracting (JOC).
    • Technology & Process: Leverages cloud platforms for information sharing and workflow management.
    • Lean Principles: Focuses on eliminating waste and improving efficiency from planning through delivery and beyond.

Why it Delivers Value:

  • Reduces Risk: Early cost visibility and validation prevents projects from becoming unfeasible later, enabling more robust financial resource utilization.
  • Increases Certainty: Better planning leads to projects finishing on time and budget.
  • Builds Trust: Transparency in costs and processes fosters better relationships.
  • Optimizes Lifecycle: Improves efficiency for repairs, maintenance, and new construction.

← Back

Thank you for your response. ✨

About Four BT, LLC (4BT) – We help to create environments where the best people come to do their best work. We all succeed together.

Join us as we pave the way toward a new future for public and private sector efficient project delivery.

4BT exclusively provides verifiable, objective, current, local market construction cost data organized using expanded CSI Masterformat and supporting technology.

-Estimate project costs comprehensively

-Ensure budgets reflect the actual current local market labor, material, and equipment costs for successful project delivery.

-Create detailed and realistic project timelines

-Identify key milestones, task dependencies, and critical paths.

-Minimize risks associated with delays and budget overruns

-Provide a clear project roadmap and cost control mechanisms.

-Enhance resource allocation and utilization

-Align resources and scheduling with budget constraints.

Note:  All trademarks, logos, and brand names are the property of their respective owners. Their use does not imply endorsement, affiliation, or any relationship with the mark’s owner.

Locally Researched vs Localized Cost Data ? – Repair, Renovation, Maintenance, or New Build

Locally Researched vs Localized Cost Data, do you know the difference? Understanding how to leverage Locally Researched vs Localized Cost Data is crucial for accurate budgeting, cost visibility, and cost management. Utilizing Locally Researched vs Localized Cost Data can significantly enhance your project outcomes.

There is only one source for Locally Researched Cost Data including repair, renovation, maintenanance, new build and also preventive maintenance cost data, updated quarterly, 90,000+ line items, organized using extended CSI Masterformat, and current used by DoD sites, as well as other State, County, and City Government organizations,  Four BT, LLC (4BT).

Integrating Locally Researched vs Localized Cost Data into your decision-making processes can lead to more informed choices.

Using Locally Researched Cost Data vs. Localized Cost Data ensures that your project estimates reflect the true costs in your area, enhancing project accuracy.

The choice between Locally Researched vs Localized Cost Data is pivotal in determining the accuracy of your financial planning.

TECHNICAL INFORMATION

Understanding the Importance of Locally Researched vs Localized Cost Data

Locally Researched vs Localized Cost Data: A Comparative Analysis

4BT offers a solution that provides higher cost visibility and greater cost management capability than “national average” cost databases, such as “RS Means Cost Data”, “BNI cost data”, and others that rely upon on location factors to approximate local market costs.  The use of location factors has been cited as introducing significant errors in cost estimation.  The latter is “localized cost data”.

To achieve precise cost management, consider integrating  Locally Researched Cost Data vs. Localized Cost Data into your estimating process.

Incorporating insights from Locally Researched vs Localized Cost Data will further enhance your project’s financial viability.

  • Locally Researched Cost Data =  Labor, Material, and Equipment Costs are all specific to the local site / area.
  • Localized Cost Data = ” National Average Cost Data”, localized to local site / area using location factors (e.g. city cost index, CCI, area cost factors…)

It’s essential to differentiate between Locally Researched vs Localized Cost Data to ensure accurate project estimates.

Construction cost data  is made up of labor, equipment, materials, and associated productivity for the defined task.  It is critical that data is gathered per the local market and that users can view, change, enhance, and share granular cost items with respect to the individual labor, equipment, material, and crews.

By focusing on Localized or Locally Research Cost Data, you can mitigate risks associated with inaccurate cost assessments.

Understanding the nuances between Locally Researched vs Localized Cost Data can mitigate financial risks.


4BT creates local market granular cost data for Government locations as per our methodology, organized by expanded CSI MasterFormat and is supported within secure (Microsoft Government Cloud)  cloud estimating software.  Optionally, assemblies can be created using a combination of expanded UNIFORMAT and CSI Masterformat, and preventive maintenance cost databases are also available and are organized using Triservices UNIFORMAT.”

With Locally Researched vs Localized Cost Data, you can refine your project cost estimates significantly.


Access to Locally Researched vs Localized Cost Data is essential for government contracts to ensure compliance and budget accuracy.

Utilizing Locally Researched vs Localized Cost Data is crucial to ensure compliance in government contracts.

Cost estimates require a continual influx of current and relevant cost data to remain credible. – GAO COST ESTIMATING AND ASSESSMENT GUIDE

Our fully dedicated team of cost researchers and engineers, who have decades of specialty field experience, source data for integration within our cloud software and work collaboratively with our technology professionals. Our team has worked for firms including The R.S. Means Company, LLC, VFA, Inc., and 4Clicks Solutions, LLC.


The integration of  Locally Researched Cost Data within our cloud technology enhances decision-making processes.

The advantages of using Locally Researched vs Localized Cost Data cannot be overstated.

Our cloud technology enables intuitive, fast, and easy access to construction cost datasets and estimates and management across multiple disparate yet collaborative teams and locations. Our SaaS (software as a service) technology is hosted on the Microsoft Azure Government cloud platform to provide the highest level of security and compliance.

Our cost data development team leverages multiple resources including business manufacturers, commodity suppliers, wholesale chain information and pricing, dynamic cost databases across disparate domains of materials and equipment, and local general contractor and subcontractor labor costs across multiple trades (130+ trades).

Our team emphasizes the importance of Locally Researched Cost Data in obtaining accurate labor, material, and equipment costs.

Emphasizing Locally Researched vs Localized Cost Data ensures an accurate understanding of market conditions.


The continuous maintenance and updated research cost dataset is used as the basis for updating and/or creating granular construction task lines.

Unlike other traditional databases, these elementary cost elements are the foundation for, and link with, granular tasks enabling over one (1) million updates for each localized dataset.

The founders established 4BT to provide a superior alternative to traditional “industry leading” cost data sets that rely upon “national average cost data” and location factoring.  As demonstrated by third party studies, location factoring cannot accurately account for local market conditions, resulting in significant errors in cost estimation for all types of repairs, renovation, maintenance, and new construction activities.  Examples of these studies/reports are as follows:

Utilizing Locally Researched Cost Data allows for more accurate cost projections and better planning. (see below third party evaluations)

The transition to using Locally Researched vs Localized Cost Data will improve your project planning processes.

Location factors are primarily used in class 4 and 5 estimates and are not intended to be used for higher quality estimates, such as class 3, 2, or 1. The RSMeans city cost index (CCI) and the Department of Defense area cost factor (ACF) index are two primary examples of location factor publications. (Martinez, A., Validation of methods for adjusting construction cost estimates by project location , University of New Mexico UNM Digital Repository, 2010)

“Despite its potential weaknesses, estimation by adjustment factors is a very common approach for all types of construction. A very common approach for performing quick-order-of-magnitude estimates is based on using Location Cost Adjustment Factors (LCAFs). The accuracy of cost estimates in the early phases varies within an expected range that spans from -100% to +200% ” “Using the results of this study, various commercial entities (e.g., RS Means) could enhance their online tools by uploading publicly available socio-economic variables and allowing users to perform geostatistical analysis. As a result, a cost engineer could input the location of a project and obtain the most accurate location adjustment factor through a mix of interpolation and geostatistical prediction techniques.” (Migliaccio, G., Empirical Assessment of Spatial Prediction Methods for Location Cost Adjustment Factors, J Constr Eng Manag. 2013)

“Problems within the methodology, unfortunately, will continue to arise as standardized estimation tools (CCI) simply cannot account for the unique characteristics of individual states. Unfortunately, the accuracy of program wide CCIs occasionally led to swings of ±20 percent after projects had gone through the bidding process. Additionally, no direct application of market or economic conditions existed in this conventional CCI process, which was theorized by FHWA to potentially be a significant influence on resulting project estimate accuracy. ”   (University of Colorado Denver College of Engineering and Applied Science Department of Civil Engineering, Validation of Project-level Construction Cost Index Estimation Methodology, 2017)

“In the United States, RSMeans and other published construction cost data are useful for estimating the overall cost of a project. However, these are typically nationally aggregated mean costs and intended to be used with a local multiplier. Prior studies have found that locally adjusted RSMeans costs vary from actual local material prices. For example, Estes (2016) found that for a slab-on-grade foundation assembly with 0.1 m (4 inches) thick slab, vapour barrier and welded wire fabric in Baton Rouge, Louisiana, United States, concrete was found to be underestimated by 18% and vapour barrier by as much as 67%. Additionally, assembly costs for 0.1 m (4 inches) thick concrete slab were found to differ significantly (p = 0.004, α = 0.05) when comparing locally sourced costs and adjusted RSMeans cost data (Estes, 2016). Published cost data also lack accuracy due to the type and manner of data collected and represented. For example, RSMeans data do not account for variations caused by local codes, productivity rates, climate conditions, labour quality and availability, or costs related to land prices and permit fees (Ontario Construction Secretariat, 2001).” (Kodavatiganti Y, Rahim MA, Friedland CJ, Mostafiz RB, Taghinezhad A and Heil S (2023), Material quantities and estimated construction costs for new elevated IRC 2015-compliant single- family home foundations. Front. Built Environ. 9:1111563. doi: 10.3389/fbuil.2023.1111563

The disparity between Locally Researched vs Localized Cost Data highlights the need for accuracy in estimates.

“Location factors are used during preliminary project evaluations. They are not intended to be used when preparing appropriation-quality estimates. They often are applied to conceptual estimates for identifying “go/no-go” projects at an early stage.” (Peitlock, B.A., ccc, Developing Location Factors Using a Factoring Method, International Cost Engineering Council, ICEC International Cost    Management Journal (ICMJ),1998.)


Locally Researched vs Localized Cost Data

Note:  All trademarks, logos, and brand names are the property of their respective owners. Their use does not imply endorsement, affiliation, or any relationship with the mark’s owner.


Maximizing efficiency requires embracing Locally Researched vs Localized Cost Data in all your construction projects.


About Four BT, LLC (4BT) – We help to create environments where the best people come to do their best work. We all succeed together.

Join us as we pave the way toward a new future for public and private sector efficient project delivery.

4BT exclusively provides verifiable, objective, current, local market construction cost data organized using expanded CSI Masterformat and supporting technology.

Our commitment to providing Locally Researched vs Localized Cost Data ensures your projects are well-informed.

4BT specializes in providing accurate Locally Researched vs Localized Cost Data tailored to local market conditions.

Through our research, we prioritize Locally Researched vs Localized Cost Data tailored to your needs.

-Estimate project costs comprehensively

Using Locally Researched vs Localized Cost Data creates a solid foundation for project estimates.

-Ensure budgets reflect the actual current local market labor, material, and equipment costs for successful project delivery.

-Create detailed and realistic project timelines

-Identify key milestones, task dependencies, and critical paths.

-Minimize risks associated with delays and budget overruns

-Provide a clear project roadmap and cost control mechanisms.

-Enhance resource allocation and utilization

-Align resources and scheduling with budget constraints.

← Back

Thank you for your response. ✨

Robust Preconstruction Process

A robust preconstruction process is critical to efficient, quality project delivery.

In the public sector, a robust preconstruction process is not optional—it is a responsibility.

Public agencies are entrusted with stewarding taxpayer funds while delivering safe, durable, and cost-effective facilities and infrastructure. Whether the work involves maintenance, repair, renovation, or new construction, the quality of decisions made during preconstruction largely determines whether projects are delivered on time, within authorized budgets, and in a manner that withstands public and regulatory scrutiny.

Many of the challenges that plague public projects—cost overruns, schedule delays, change orders, and disputes—are not failures of construction execution. They are failures of preconstruction planning, coordination, and alignment.

A disciplined, transparent, and repeatable preconstruction process is therefore essential to predictable outcomes.


The Role of Preconstruction in the Public Sector

Preconstruction in the public sector serves a distinct purpose: reducing uncertainty while ensuring accountability.   Public projects must (or should) operate within statutory procurement rules, fixed appropriations, audit requirements, and heightened public visibility.

A robust preconstruction process helps public owners:

  • Validate scope and budget alignment before funds are committed

  • Identify and mitigate risks early, when mitigation is least costly

  • Ensure compliance with procurement, labor, and funding requirements

  • Provide defensible, data-driven justifications for decisions

When implemented effectively, preconstruction enables agencies to deliver projects that meet public needs while maintaining transparency and fiscal responsibility.


Core Elements of a Robust Public-Sector Preconstruction Process

1. Early and Ongoing Integration of Planning, Procurement, and Project Delivery Teams

Public projects often suffer when planning, procurement, and delivery functions operate independently. Preconstruction must intentionally integrate these groups early and maintain collaboration throughout the planning process.

Early integration ensures that:

  • Program and scope decisions reflect real market conditions

  • Procurement strategies align with project complexity, risk, and schedule constraints

  • Delivery teams provide constructability, phasing, and risk input before documents are finalized

Ongoing collaboration reduces late-stage scope changes, minimizes procurement delays, and improves bid quality and pricing.


2. Collaborative Project Delivery Method and a Formal Execution Plan

Selecting a collaborative project delivery method is critical for public-sector success. Regardless of whether the agency uses Design-Bid-Build, CM at Risk, Design-Build, or other authorized methods, collaboration must be formalized through a written project execution plan or operations manual.

This document should:

  • Clearly define roles, responsibilities, and lines of authority

  • Establish shared project objectives tied to cost, schedule, quality, and safety

  • Quantitatively define performance metrics and reporting requirements

  • Align incentives and accountability to promote problem-solving rather than claims

A formal execution plan provides a defensible framework for decision-making and ensures consistency across projects, staff, and delivery partners.

“According to the GAO Cost Estimating and Assessment Guide, reliable cost estimates and disciplined cost management are essential to realistic project planning and budgeting. GAO’s best practices support the use of standardized, verifiable data throughout preconstruction.”


3. Mandatory Initial and Ongoing Training

Public agencies often rely on a mix of internal staff, consultants, and contractors—many of whom may rotate in and out of projects. Mandatory initial and ongoing training ensures consistent understanding and application of preconstruction processes.

Training should cover:

  • Applicable procurement statutes and agency policies

  • The selected delivery method and execution plan

  • Cost estimating standards, risk management practices, and change control

  • Roles, responsibilities, and communication protocols

Ongoing training supports staff continuity, improves institutional knowledge, and strengthens the agency’s ability to deliver projects consistently over time.  (see: GAO‑20‑195G: Cost Estimating and Assessment Guide — Best Practices for Developing and Managing Program Costs )


4. A Common, Shared, and Transparent Data Environment

Transparency is a fundamental public-sector requirement. A robust preconstruction process relies on a common, shared data environment that is accessible, auditable, and based on objective information.

This environment should include:

A shared data environment enables informed decision-making, improves public trust, and provides a clear audit trail for oversight bodies and funding agencies.


Delivering Predictable Outcomes and Public Value

When these core elements are implemented together, preconstruction becomes a tool for risk reduction, fiscal discipline, and public accountability. Agencies benefit from:

  • More reliable cost and schedule outcomes

  • Reduced change orders and claims

  • Improved bid quality and market participation

  • Greater transparency and defensibility of decisions

Most importantly, a robust preconstruction process allows public agencies to deliver lasting public value—projects that meet community needs, respect taxpayer investment, and stand up to scrutiny long after completion.


Summary

There are several core elements that are required to ensure the consistent delivery of repair, renovation, maintenance, or new builds on time, on budget, and to the statisfaction of all participants and stakeholders.

robust preconstruction process
Robust Preconstruction Process Elements

Core elements of a robust preconstruction process include

  • The early and ongoing integration and collaboration Planning, Procurement, and Project Delivery Teams
  • A collaborative project delivery method and associated written operations manual/execution plan that quantitatively defines mutually beneficial outcomes for all participants and stakeholders.
  • Mandatory initial and ongoing training
  • A common, shared, transparent data environment, including verifiable, objective, granular, standardized, and locally researched construction task and cost data.

← Back

Thank you for your response. ✨

Collaborative AECOO environments

At 4BT.US, collaborative construction cost data is at the core of how projects are planned, designed, and delivered for better outcomes. By uniting the strengths of every professional involved in planning, design, and project execution, we create environments where creative problem-solving thrives and shared success becomes the standard. Our commitment to fostering collaborative relationships ensures that stakeholders from various disciplines can contribute their insights and expertise effectively, leading to innovative solutions that enhance project outcomes.

 True innovation in the AECOO industry emerges from collaboration​.

Our team brings deep expertise in labor, materials, and equipment cost analysis; commercial building codes; and construction processes to support informed decision-making across the AECOO sector. We exclusively provide current, objective, verifiable, granular, and standardized local market cost data that powers truly collaborative construction cost data workflows throughout the project lifecycle. This depth of knowledge allows us to not only identify cost-saving opportunities but also ensure compliance with industry standards and regulations, ultimately reducing risks and enhancing project viability.

This integrated approach enables cost transparency, effective cost management, and sustainable lifecycle stewardship of the built environment. It delivers tangible value to owners, design-build teams, and oversight organizations seeking reliable, data-driven support for planning, budgeting, and project delivery. By employing advanced analytics and modeling techniques, we help stakeholders visualize costs in real-time, facilitating better budget adherence and resource allocation, while also fostering a culture of accountability and continuous improvement across all project phases.


collaborative construction cost data

Ultimately, the goal of enhancing collaborative construction cost data practices is to create a more sustainable and efficient built environment. By focusing on transparency, accountability, and collective problem-solving, we can ensure that future projects not only meet budgetary constraints but also contribute positively to the communities they serve. As we look to the future, let us continue to champion collaboration and innovation as the cornerstones of successful construction practices.

As we move forward, it is essential to embrace a culture of innovation and adaptability. The AECOO industry is constantly evolving, and so must our approaches to project management and cost data collaboration. Engaging in continuous learning and adopting best practices from other industries can further enhance our collaborative efforts, ensuring that we remain at the forefront of effective construction management.

Moreover, case studies from recent projects highlight the effectiveness of collaborative practices. For example, in a large-scale commercial development, implementing collaborative construction cost data strategies led to a 20% reduction in overall project costs and significantly improved timelines. This success story demonstrates how aligning interests and leveraging collective expertise can yield substantial benefits, not just for the project at hand but for future endeavors.

The role of technology in enhancing collaborative construction cost data cannot be overstated. Digital tools and platforms facilitate real-time communication among team members, streamline data sharing, and provide comprehensive analytics that empower decision-makers.

← Back

Thank you for your response. ✨

At 4BT.US, we believe that true innovation in the AECOO industry emerges from collaboration. By uniting the strengths of every professional involved in planning, design, and project delivery, we create environments where creative problem-solving thrives and shared success becomes the standard. This ethos drives our commitment to continuous improvement and excellence in the delivery of collaborative construction cost data, ensuring that all participants can achieve their project objectives efficiently and effectively.

Our team brings an exceptional depth of expertise across labor, materials, and equipment cost analysis; commercial building codes; and construction processes. We exclusively provide current, objective, verifiable, granular, and standardized local market cost data that drives informed decision-making throughout the project lifecycle. We specialize in implementing collaborative delivery frameworks that enable sustainable lifecycle management of the built environment, ensuring that every project not only meets its immediate goals but also aligns with long-term sustainability objectives.

4BT’s comprehensive approach ensures cost transparency, effective cost management, and meaningful support for owners, design-build teams, and oversight organizations alike. By harnessing the power of collaborative construction cost data, we are paving the way for a more integrated and successful future in the AECOO industry.

FM Alignment and Buy-In

Common AECOO Data Stack

Common AECOO Data Stack


1. Purpose and Scope

This  Four BT (4BT)  methodology defines how to maintain a robust, rule-based environment across MasterFormat, OmniClass, and UniFormat for cost, BIM, IFC, and FM workflows. Static, one-to-one spreadsheets cannot keep pace with evolving standards, project variation, and the full MasterFormat catalog, and they often create misleading “equivalences” that do not hold under audit or lifecycle use.

Instead of forcing single-target mappings, the 4BT applies a rule-based model that can express multiple valid classification relationships per cost line. This model scales to all 8,000+ MasterFormat titles, supports discipline-specific nuance, and preserves the distinction between systems, elements, work results, and products across the asset lifecycle.


2. Classification Governance

4BT adopts a governance model that assigns a clear, canonical role to each classification standard. This prevents crosswalk misuse, avoids “overloading” any one standard, and keeps cost, BIM, and FM aligned over time.

  • UniFormat™ – Systems and assemblies (WHAT exists). UniFormat organizes information around building systems and assemblies rather than trades, making it well suited to early design, asset breakdown structures, and lifecycle-oriented system thinking.

  • OmniClass™ Table 21 – Element context (WHERE it belongs). Table 21 classifies elements by their functional role in the facility, providing a bridge between system-level thinking (UniFormat) and detailed work results and products.

  • OmniClass™ Table 22 – Work results (HOW it is built). Table 22 focuses on work results delivered in the construction phase and closely aligns with the structure and intent of MasterFormat sections.

  • MasterFormat® – Contractual and cost scope. MasterFormat organizes specifications and cost items by work results, materials, and trades, and is used to structure estimates, bids, and contracts.

  • OmniClass™ Table 23 – Products and equipment (WITH WHAT). Table 23 provides a stable, lifecycle-oriented way to identify maintainable products and equipment, supporting FM, reliability analysis, and asset management.

Within this governance model, MasterFormat is not treated as a system model and is not used to represent asset breakdown structures or spatial organization. UniFormat and OmniClass Tables 21 and 23 provide those roles, while Table 22 and MasterFormat focus on work results and contractual scope.


3. Applicability Model

4BT uses an applicability model rather than a mandatory 1:1 mapping. Each MasterFormat section can have multiple valid classification relationships, each tagged according to its role in context.

  • PRIMARY – The most common or canonical classification relationship for a given cost line or work package in typical building projects.

  • SECONDARY – An additional relationship that is technically valid but less frequently used, discipline-specific, or context-specific.

  • CONTEXT_DEPENDENT – A relationship that may or may not apply depending on project delivery method, system boundaries, or owner requirements.

Applicability explicitly does not imply equivalence. A PRIMARY link indicates that a classification is usually appropriate, not that it is the only correct interpretation or that codes are semantically interchangeable. This distinction is critical for licensing, audit defensibility, and lifecycle data quality.


4. Rule Hierarchy (The Engine)

The crosswalk is implemented as a layered rule engine rather than a flat spreadsheet. Each layer expresses a specific relationship that can be maintained, audited, and extended independently.

  1. MasterFormat Division → OmniClass Table 22

    • Division-level rules define the allowable OmniClass Table 22 work result ranges for sections within that division.

    • This captures the natural alignment between MasterFormat and Table 22 while allowing for exceptions and multi-division work packages.

  2. OmniClass Table 22 → OmniClass Table 21

    • Rules at this layer connect work results to their corresponding elements, clarifying where a given work result “lives” in the facility context.

    • This supports element-based reporting, scope definition, and BIM views that focus on building functions rather than trades.

  3. OmniClass Table 21 → UniFormat Level 4

    • This layer links elements to system and assembly breakdown structures at UniFormat Level 4.

    • It enables aggregation of costs and quantities by system, supports asset hierarchies, and provides a bridge from design-oriented elements to owner-facing system views.

  4. Optional OmniClass Table 23 Linkage

    • Where appropriate, rules connect elements and systems to specific products and equipment in Table 23.

    • This optional linkage is particularly valuable for COBie, CMMS, FCA/Capital Planning and Management, and reliability/maintenance planning, where product-level identifiers are required.

Because rules are layered, 4BT can update or expand a single layer (for example, new Table 23 products or revised UniFormat codes) without rewriting the entire crosswalk. This design is what enables dynamic generation for all 8,000+ MasterFormat sections rather than fragile, one-off mappings.


5. Automation and Scalability

The rule tables are designed to be consumed programmatically by scripting and BI tools such as Python and Power Query. When licensed 4BT cost data is supplied, the automation engine applies the rules to each cost line to generate classifications for the desired standards.

  • Rules are stored in structured tables (division_to_oc22_rulesoc22_to_oc21_rulesoc21_to_uniformat_l4_rules), not hard-coded in macros or hidden logic.

  • Scripts and queries read these tables, apply the PRIMARY / SECONDARY / CONTEXT_DEPENDENT logic, and write back enriched cost lines with attached UniFormat, OmniClass, and, where applicable, product-level codes.

This approach allows the same methodology to be applied across multiple cost databases, project types, and client portfolios without duplicating crosswalk spreadsheets. It also supports continuous improvement: rule changes can be versioned, tested, and rolled out without disrupting existing client data.


6. BIM / IFC / COBie Alignment

The methodology is explicitly designed to support BIM, IFC, and COBie handover requirements. By keeping systems, elements, work results, and products in their correct classification “homes,” the crosswalk ensures that downstream models and datasets remain coherent.

  • Systems and assemblies (UniFormat) and elements (OmniClass Table 21) align with typical IFC object hierarchies and model views.

  • Work results (OmniClass Table 22 and MasterFormat) align with specifications, trade packages, and construction-phase documentation.

  • Products and equipment (OmniClass Table 23) align with COBie component records and FM/CMMS asset registers.

This layered alignment supports consistent identifiers from early design through construction and into operations, reducing rework and manual recoding at handover. It also enables owners to define classification expectations once and reuse them across projects, regardless of the specific tools or authoring platforms in play.


7. Disclaimer

This methodology defines an applicability-based crosswalk, not a set of semantic equivalences between classification codes. A PRIMARY, SECONDARY, or CONTEXT_DEPENDENT relationship indicates that a pairing is appropriate for use under defined conditions, not that the underlying standards share identical meanings, scopes, or licensing terms.

Final assignment of classifications for any given project may vary based on scope, delivery method, owner requirements, or jurisdictional constraints, and should always be reviewed by qualified professionals. Use of this methodology does not alter the official definitions, ownership, or licensing requirements of any referenced standard.

Note:  All trademarks, logos, and brand names are the property of their respective owners. Their use does not imply endorsement, affiliation, or any relationship with the mark’s owner.

About Four BT, LLC (4BT)  www.4bt.us

We help to create environments where the best people come to do their best work. We all succeed together.

Join us as we pave the way toward a new future for public and private sector efficient project delivery.

4BT exclusively provides verifiable, objective, current, local market construction cost data organized using expanded CSI Masterformat and supporting technology.

-Estimate project costs comprehensively

-Ensure budgets reflect the actual current local market labor, material, and equipment costs for successful project delivery.

-Create detailed and realistic project timelines

-Identify key milestones, task dependencies, and critical paths.

-Minimize risks associated with delays and budget overruns

-Provide a clear project roadmap and cost control mechanisms.

-Enhance resource allocation and utilization

-Align resources and scheduling with budget constraints.

Building System Lifecycles Uniformat

Building System Lifecycles Uniformat – Uniformat

Understanding Building System Lifecycles Uniformat

Life
(Years)
Weight
(1-100)
A Substructure 150
A10 Foundations 150
A1010 Standard Foundations 150 75
A101004 Standard Foundations Repairs 20 75
A1030 Slab on Grade 150 50
A20 Basement Construction 100
A2020 Basement Walls 100 60
B Shell 50
B10 Superstructure 150
B1010 Floor Construction 50 70
B101001 Structural Frame 150 70
B101008 Floor Expansion Joints 20 70
B1020 Roof Construction 50 75
B20 Exterior Enclosure 25
B2010 Exterior Walls 75 65
B201011 Exterior Walls – Joint Sealant 12 65
B201012 Exterior Walls – EIFS 35 65
B201013 Exterior Walls – Glass block 25 65
B201014 Exterior Walls – Masonry Re – pointing 20 65
B201015 Exterior Walls – Metal Siding 25 65
B201016 Exterior Walls – Precast Wall Panels 50 65
B201017 Exterior Walls – Stucco 25 65
B201018 Exterior Walls – Vinyl Siding 20 65
B201019 Exterior Walls – Brick 50 65
B201020 Exterior Walls – Granular impregnated wall board 60 65
B201021 Exterior Walls – Curtain Wall System 35 65
B2020 Exterior Windows 32 70
B202005 Exterior Windows – Sealant Replacement 12 70
B2030 Exterior Doors 27 60
B203004 Exterior Doors – Overhead and Roll – up 20 30
B203008 Exterior Doors – Hardware 15 30
B203009 Exterior Doors – Barrier Free Hardware 15 60
B30 Roofing 22
B3010 Roof Coverings 22 80
B3020 Roof Openings 22 80
B302006 Roof Openings – Skylight 20 80
C Interiors 20
C10 Interior Construction 75
C1010 Partitions 75 10
C101003 Partitions – Moveable 20 10
C1020 Interior Doors 25 20
C102005 Interior Doors – Overhead 20 20
C102007 Interior Doors – Hardware 15 20
C102009 Interior Doors – Barrier Free Hardware 10 20
C1030 Fittings 25 40
C103001 Fittings – Washroom Partitions 15 40
C103002 Fittings – Washroom Accessories 15 20
C103003 Fittings – Chalk/White Boards 15 20
C103005 Fittings – Lockers 15 20
C103009 Fittings – Millwork 25 40
C103013 Fittings – Retractable Stage ( Raised Access Floor) 25 40
C103016 Fittings – Bleachers 25 40
C103017 Fittings – Auditorium Seating 25 40
C103018 Fittings – Window Coverings 10 30
C20 Stairs 45
C2010 Stair Construction 40 100
C2020 Stair Finishes 30 25
C30 Interior Finishes 20
C3010 Wall Finishes 15 25
C301002 Wall Finishes – Plaster 15 25
C301003 Wall Finishes – Gypsum 15 25
C301004 Wall Finishes – Ceramic 15 25
C301005 Wall Finishes – Paint 5 25
C301006 Wall Finishes – Vinyl (Wall Paper) 15 25
C301007 Wall Finishes – Acoustic Panel 15 25
C301009 Wall Finishes – Terrazo 50 25
C301011 Wall Finishes – Quarry Tile 30 25
C301012 Wall Finishes – Porcelain 30 25
C301013 Wall Finishes – Granite 30 25
C301014 Wall Finishes – Marble 30 25
C301015 Wall Finishes – Brick 30 25
C301016 Wall Finishes – Wood Panel 15 25
C301017 Wall Finishes – Stucco 15 25
C301018 Wall Finishes – Glazed 15 25
C301019 Wall Finishes – Waterproof Membrane 15 25
C301099 Wall Finishes – Other 15 25
C3020 Floor Finishes 15 45
C302001 Floor Finishes – Ceramic 15 40
C302002 Floor Finishes – Terrazzo 50 40
C302003 Floor Finishes – Wood 20 40
C302004 Floor Finishes – Vinyl Tile 15 40
C302005 Floor Finishes – Carpet 10 50
C302006 Floor Finishes – Masonry and Stone 25 40
C302007 Floor Finishes – Painted Sealed Concrete 25 40
C302011 Floor Finishes – Quarry Tile 25 40
C302012 Floor Finishes – Porcelain 25 40
C302013 Floor Finishes – Granite 25 40
C302014 Floor Finishes – Marble 25 40
C302015 Floor Finishes – Vinyl Sheet 15 40
C302016 Floor Finishes – Rubber 15 40
C302017 Floor Finishes – Composite 15 40
C302019 Floor Finishes – Waterproof Membrane 15 40
C302020 Floor Finishes – Control Joints 15 40
C302099 Floor Finishes – Other 15 40
C3030 Ceiling Finishes 25 30
C303001 Ceiling Finishes – Exposed Concrete 20 30
C303002 Ceiling Finishes – Plaster 20 30
C303003 Ceiling Finishes – Gypsum 20 30
C303004 Ceiling Finishes – Acoustic 20 30
C303005 Ceiling Finishes – Wood 20 30
C303006 Ceiling Finishes – Paint 15 30
C303008 Ceiling Finishes – Metal 20 30
D Services 25
D10 Conveying 20
D1010 Elevators and Lifts 30 70
D101011 Elevators and Lifts – Passenger – Traction 25 70
D101012 Elevators and Lifts – Passenger – Hydraulic 25 70
D101021 Elevators and Lifts – Freight – Traction 30 50
D101022 Elevators and Lifts – Freight – Hydraulic 30 50
D101004 Elevators and Lifts – Wheelchair Lift 25 80
D20 Plumbing 50
D2010 Plumbing Fixtures 35 30
D201001 Plumbing Fixtures – Water Closets 35 30
D201002 Plumbing Fixtures – Urinals 35 30
D201003 Plumbing Fixtures – Lavatories 30 30
D201004 Plumbing Fixtures – Sinks 35 30
D201006 Plumbing Fixtures – Drinking Fountains and Coolers 30 30
D201010 Plumbing Fixtures – Accessible Washroom 35 30
D201011 Plumbing Fixtures – Eyewash Station 15 30
D2020 Domestic Water Distribution 35 45
D202001 Domestic Water Distribution – Pipes and Fittings 30 45
D202030 Domestic Water Distribution – Natural Gas DWH 25 40
D202031 Domestic Water Distribution – Electric DWH 25 40
D202033 Domestic Water Distribution – Pumps 25 40
D202034 Domestic Water Distribution – Water Storage Tanks 25 40
D202035 Domestic Water Distribution – Water Treatment Systems 25 40
D202099 Domestic Water Distribution – Other Supply 25 40
D2030 Sanitary Waste 35 60
D203099 Sanitary Waste – Other 35 60
D2040 Rain Water Drainage 35 60
D204099 Rain Water Drainage – Other System 40 60
D2090 Other Plumbing 35 55
D209002 Other Plumbing – Acid Waste Systems 35 55
D209003 Other Plumbing – Interceptors 20 50
D209004 Other Plumbing – Pool Piping and Equipment 20 55
D209005 Other Plumbing – Compressed Air System (Non-Breathing) 25 55
D209099 Other Plumbing – Other Systems 15 55
D30 HVAC 25
D3010 Energy Supply 25 70
D301001 Energy Supply System- Oil 28 50
D301002 Energy Supply System – Natural Gas 35 70
D301004 Energy Supply System – Steam from Central Plant 45 50
D301005 Energy Supply System – Hot Water from Central Plant 45 50
D301006 Energy Supply System – Solar 35 40
D301007 Energy Supply System – Wind 35 40
D301010 Energy Supply System – Propane 25 70
D301011 Energy Supply System – Cold Water from Central Plant 45 50
D3020 Heat Generating 25 85
D302001 Heat Generating – Steam Boilers 25 85
D302002 Heat Generating – Hot Water Boilers 25 85
D302003 Heat Generating – Furnaces 15 85
D302004 Heat Generating – Fuel – Fired Unit Heaters 20 60
D302006 Heat Generating – Equipment Thermal Insulation 25 50
D302050 Auxiliary Equipment – Chemical 25 60
D302051 Auxiliary Equipment – Expansion Tanks 25 85
D302052 Auxiliary Equipment – Heat Exchanger 25 85
D302053 Auxiliary Equipment – Humidifiers 25 85
D302054 Auxiliary Equipment – HVAC Pumps 25 85
D302055 Auxiliary Equipment – Stacks & Breaching 25 85
D302056 Auxiliary Equipment – Variable Frequency Drives (VFD) 25 85
D302057 Auxiliary Equipment – Glycol 25 85
D302099 Heat Generating – Other 25 85
D302098 Roof Top AHU –  Heat&Cool 25 60
D302097 Make – Up AHU 25 60
D3030 Cooling Generating Systems 30 55
D303011 Chilled Water Systems – Chillers 30 55
D303012 Chilled Water Systems – Cooling Towers 30 55
D303099 Cooling Generating Systems – Other 30 50
D3040 Distribution Systems 25 75
D304001 Distribution Systems – Air Distribution, Heating & Cooling 30 50
D304002 Distribution Systems – Steam Distribution Systems 45 50
D304003 Distribution Systems – Heated Water Distribution Systems 20 80
D304004 Distribution Systems – Change-over Distribution System 25 40
D304005 Distribution Systems – Glycol Distribution Systems 45 50
D304006 Distribution Systems – Chilled Water Distribution Systems 20 55
D304007 Distribution Systems – Exhaust Systems 22 35
D304008 Air Handling Units 12 50
D3050 Terminal and Package Units 25 60
D305001 Terminal and Package Units – Unit Ventilators 12 60
D305002 Terminal and Package Units – Unit Heaters 30 60
D305003 Terminal and Package Units – Fan Coil Units 30 60
D305004 Terminal and Package Units – Fin Tube Radiation 30 60
D305006 Terminal and Package Units – Package Units 30 60
D305099 Terminal and Package Units – Other 25 60
D305007 Terminal and Package Units – Heat Pumps 30 60
D3060 Controls and Instrumentation 25 55
D306002 Controls and Instrumentation – Electronic 25 55
D306003 Controls and Instrumentation – Pneumatic 30 50
D306004 Building Automation System (F105002) 15 50
D3090 Other HVAC Systems and Equipment 20 55
D309002 Other HVAC Systems and Equipment – Refrigeration Systems 30 50
D40 Fire Protection 40
D4010 Sprinklers 47 100
D4020 Standpipe Systems 45 100
D4090 Other Fire Protection Systems 40 100
D409001 Carbon Dioxide System 10 100
D409005 Other Fire Protection Systems – Hood and Duct 40 100
D409006 Other Fire Protection Systems – Fire Pumps 25 100
D409008 Other Fire Protection Systems – Smoke Fans 25 100
D50 Electrical 50
D5010 Electrical Service and Distribution 25 85
D501001 Electrical Service and Distribution – Main Transformer 30 85
D501002 Electrical Service and Distribution – Secondary Transformer 30 75
D501003 Electrical Service and Distribution – Main Switchboard 30 85
D501004 Electrical Service and Distribution – Interior Distribution Transformer 30 75
D501005 Electrical Service and Distribution – Panel 30 75
D501007 Electrical Service and Distribution – Motor Control Centre 30 75
D501099 Electrical Service and Distribution – Other 30 25
D5020 Lighting and Branch Wiring 25 60
D502001 Lighting and Branch Wiring – Branch Wiring 50 35
D502003 Lighting and Branch Wiring – Interior Lighting 35 55
D502004 Lighting and Branch Wiring – Exterior Lighting 15 55
D502005 Lighting and Branch Wiring – Exit Lighting and Signs 35 55
D502006 Lighting and Branch Wiring – Stage Lighting 35 55
D502007 Lighting and Branch Wiring – Emergency Lighting 35 75
D5030 Communications and Security 20 75
D503001 Communication and Security – Fire Alarm 20 100
D503002 Communication and Security – Telecommunications Systems 25 100
D503004 Communication and Security – Public Address 25 80
D503007 Communication and Security – CCTV 25 35
D503008 Communication and Security – Security 15 35
D503021 Communication and Security – IT – Infrastructure 25 35
D503099 Communication and Security – Other 8 45
D5090 Other Electrical 35 60
D509002 Other Electrical – Emergency Lighting and Power 30 100
D509003 Other Electrical – Grounding 50 70
D509005 Other Electrical – Electric Heating 30 60
D509095 Other Special Systems and Devices – Methane Venting Systems 20 70
D509096 Other Special Systems and Devices – Shop Compressed Air Systems 15 30
D509097 Other Special Systems and Devices – Dust Collector 15 30
D509098 Other Special Systems and Devices – Auto Hoist 15 30
D509099 Other Special Systems and Devices 35 80
E Equipment & Furnishings
E10 Equipment (Fixed Items) 10 10
E20 Furnishings (Fixed Items) 10 10
F Special Construction & Demolition
F10 Special Construction
F1010 Special Structures
F101001 Metal Building Systems (Portables) 25 10
F1050 Special Controls and Instrumentation
F1060 Specialized Program Space 20 10
F106001 Double/Large Gymnasium 20 10
F106002 Single Gymnasium 20 10
F106003 Library Resource Centre 20 10
F106004 Science Laboratory 20 10
F106005 Board Based Technology Shop ‐Large 20 10
F106006 Board Based Technology Shop ‐Small 20 10
F106007 General Purpose Room 20 10
F106008 Cafeteria/Cafetorium 20 10
F106009 Auditorium/Theatre 20 10
F106010 Music Room 20 10
F106011 Visual Arts Room 20 10
F106012 Exercise Room 20 10
F106013 Business/Computer Room 20 10
F106014 Kindergarten Room 20 10
F106015 Childcare 20 10
F106016 Special Needs Room 20 10
F106017 Safe Schools – Entrance and Office 20 10
F20 Selective Building Demolition
F2020 Hazardous Components Abatement 10
G Building Sitework 18
G10 Site Preparation
G1040 Hazardous Waste Reduction 10
G20 Site Improvements 10
G2010 Roadways 25 30
G201003 Roadways – Paved 20 30
G201010 Roadways – Unpaved 20 30
G2020 Parking Lots 20 30
G202003 Parking Lots – Paved 20 30
G202010 Parking Lots – Unpaved 20 30
G2030 Pedestrian Paving 20 30
G203003 Pedestrian Paving – Paved 10 30
G203010 Pedestrian Paving – Unpaved 10 30
G203099 Other Walks, Steps and Terraces 15 30
G2040 Site Development 35 50
G204001 Site Development – Fencing and Gates 25 50
G204002 Site Development – Retaining Walls 50 50
G204005 Site Development – Signage 10 50
G204010 Site Development – Exterior Stairs 15 50
G204011 Site Development – Exterior Ramps 10 50
G204071 Site Development – Playing Fields – Unpaved 15 25
G204072 Site Development – Playing Fields – Paved 15 25
G204099 Site Development – Other 35 25
G2050 Landscaping 20 10
G205007 Landscaping – Irrigation 10 20
G30 Site/Civil Mechanical Utilities 50
G3010 Water Supply 50 90
G301001 Water Supply – Well Systems 30 80
G301004 Fire Protection Water Distribution 50 90
G301005 Fire Protection Water Storage 50 90
G3020 Sanitary Sewer 50 50
G302005 Sanitary Sewer – Septic Tanks 50 50
G302006 Drain Fields 40 50
G3030 Storm Sewer 50 35
G303007 Storm Sewer – Stormwater Management 25 35
G3060 Fuel Distribution 25 40
G40 Site Electrical Utilities 50
G4010 Electrical Distribution 50 65
G4020 Site Lighting 25 30
G90 Other Site Construction 30 40


Project Delivery Methods Comparision


Building System Lifecycles Uniformat

Building System Lifecycles Uniformat
commerical cost


About Four BT, LLC


We help to create environments where the best people come to do their best work. We all succeed together.

Join us as we pave the way toward a new future for public and private sector efficient project delivery.


  • Estimate project costs comprehensively – Ensure budgets reflect the actual current local market labor, material, and equipment costs for successful project delivery.
  • Create detailed and realistic project timelines – Identify key milestones, task dependencies, and critical paths.
  • Minimize risks associated with delays and budget overruns – Provide a clear project roadmap and cost control mechanisms.
  • Enhance resource allocation and utilization – Align resources and scheduling with budget constraints.


www.4bt.us

Superiority of Local Granular Data

The Superiority of Local Granular Data to factored national averages exists for several key reasons, primarily due to enhanced accuracy, transparency, and relevance to specific project conditions. This approach better reflects actual market dynamics and mitigates significant financial risks. 
Superiority of Local Granular Data
  • Accuracy: Locally sourced data captures the unique variances influencing costs in a specific location, such as local labor rates, material availability and pricing, equipment costs, and regulatory requirements. National averages, even with location factors, often fail to capture these fine details, leading to potential inaccuracies of 30-40% or more in cost estimates.
  • Granularity and Detail: Granular data is broken down into detailed line items (e.g., specific costs for each task, material, and labor component), providing comprehensive cost visibility and control. National averages are typically generalized and broad, which limits detailed cost management and tracking.
  • Current Market Conditions: Local databases are fully updated more frequently (e.g., an entire new database provided quarterly) to reflect current, dynamic market fluctuations, supply chain disruptions, or labor shortages. National average database can lag behind current conditions, leading to outdated estimates.
  • Contractor Alignment: Estimates based on local data align better with how local subcontractors and suppliers prepare their bids (hard bids) reducing potential disputes, change orders, and negotiation friction.
  • Risk Mitigation: Using data that reflects real-world local conditions helps project managers make more informed decisions, identify risks (like material price changes), and manage budgets more effectively, ultimately reducing the risk of cost overruns and project delays.
  • Transparency and Verifiability: Locally researched data is typically objective and verifiable, allowing for a transparent breakdown of costs. In contrast, location factors can involve a degree of subjectivity and general averaging. 
Limitations of Factored National Averages
  • Inherent Inaccuracy: Location factors are generally intended for early, high-level (Class 4 or 5) estimates and are not reliable for detailed, “appropriation-quality” estimates.
  • Oversimplification: A single multiplier for an entire city or region cannot accurately reflect cost variations between different neighborhoods or specific site conditions.
  • Market Lag: National indexes often do not respond quickly to rapid local market changes in supply and demand, leading to significant discrepancies between estimated and actual costs. 
In essence, while national averages provide a useful initial reference, local, granular data is essential for reliable budgeting, effective cost management, and successful project delivery in the construction industry. 
Superiority of Local Granular Data

Superiority of Local Granular Data
commerical cost
References

#1. – “Location factors are used during preliminary project evaluations. They are not intended to be used when preparing appropriation-quality estimates. They often are applied to conceptual estimates for identifying “go/no-go” projects at an early stage.” (Peitlock, B.A., ccc, Developing Location Factors Using a Factoring Method, International Cost Engineering Council, ICEC International Cost   Management Journal (ICMJ), 1998.)

#2. Location factors are primarily used in class 4 and 5 estimates and are not intended to be used for higher quality estimates, such as class 3, 2, or 1. The RSMeans city cost index (CCI) and the Department of Defense area cost factor (ACF) index are two primary examples of location factor publications. (Martinez, A., Validation of methods for adjusting construction cost estimates by project location , University of New Mexico UNM   Digital Repository, 2010)

#3. “Despite its potential weaknesses, estimation by adjustment factors is a very common approach for all types of construction. A very common approach for performing quick-order-of-magnitude estimates is based on using Location Cost Adjustment Factors (LCAFs). The accuracy of cost estimates in the early phases varies within an expected range that spans from -100% to +200% ” “Using the results of this study, various commercial entities (e.g., RS Means) could enhance their online tools by uploading publicly available socio-economic variables and allowing users to perform geostatistical analysis. As a result, a cost engineer could input the location of a project and obtain the most accurate location adjustment factor through a mix of interpolation and geostatistical prediction techniques.” (Migliaccio, G., Empirical Assessment of Spatial Prediction Methods for Location Cost Adjustment Factors, J Constr Eng Manag. 2013)

#4. “Problems within the methodology, unfortunately, will continue to arise as standardized estimation tools (CCI) simply cannot account for the unique characteristics of individual states.  Unfortunately, the accuracy of program-wide CCIs occasionally led to swings of ±20 percent after projects had gone through the bidding process. Additionally, no direct application of market or economic conditions existed in this conventional CCI process, which was theorized by FHWA to potentially be a significant influence on resulting project estimate accuracy. ”    (University of Colorado Denver College of Engineering and Applied Science Department of Civil Engineering, Validation of Project-level   Construction Cost Index Estimation Methodology, 2017)

About Four BT, LLC (4BT

We help to create environments where the best people come to do their best work. We all succeed together.

Join us as we pave the way toward a new future for public and private sector efficient project delivery.

4BT exclusively provides verifiable, objective, current, local market construction cost data organized using expanded CSI Masterformat and supporting technology.

-Estimate project costs comprehensively

-Ensure budgets reflect the actual current local market labor, material, and equipment costs for successful project delivery.

-Create detailed and realistic project timelines

-Identify key milestones, task dependencies, and critical paths.

-Minimize risks associated with delays and budget overruns

-Provide a clear project roadmap and cost control mechanisms.

-Enhance resource allocation and utilization

-Align resources and scheduling with budget constraints.

← Back

Thank you for your response. ✨

Critical Evaluation of Modern Job Order Contracting

White Paper: Critical Evaluation of Modern Job Order Contracting (JOC) Frameworks in Public Procurement
Date: December 19, 2025
Subject: Analyzing the Balance Between Procurement Speed and Fiduciary Oversight
Focus: Risks and Benefits of Third-Party Managed JOC Models
Critical Evaluation of Modern Job Order Contractin

Executive Summary
Job Order Contracting (JOC) has become a staple for many public agencies seeking to expedite construction, maintenance, and repair projects. While current market-leading JOC providers promise reduced administrative burdens and rapid project commencement, recent third-party audits and industry analyses suggest these efficiencies may come at the expense of fiscal transparency. This paper examines the tension between “speed-to-market” benefits and the systemic failures in cost control and fiduciary duty identified in numerous public sector implementations.

1. Introduction to the Managed JOC Model
Job Order Contracting is an Indefinite Delivery/Indefinite Quantity (IDIQ) procurement method that allows agencies to complete numerous projects through a single, competitively solicited contract. Current market-leading frameworks utilize a standardized Unit Price Book (UPB) to establish fixed costs for thousands of individual construction tasks. In theory, this eliminates the need to bid individual projects, shifting the focus from price discovery to project execution.
2. The Primary Benefit: Procurement Acceleration
The most significant verified benefit of managed JOC programs is the drastic reduction in procurement lead times.
  • Reduced Lead Times: Traditional Design-Bid-Build cycles can often take several months. In contrast, JOC frameworks allow routine projects to move from scope to site commencement in as little as 10 to 30 days.
  • Reduced Administrative Overhead: By utilizing a “managed JOC Program” or pre-solicited cooperative contracts, local agencies bypass the repetitive legal and administrative costs of advertising, evaluating, and awarding individual bids for minor works.
3. Critical Analysis of Fee Structures and “Hidden” Costs
A primary point of contention in current “market leading” JOC models is the underlying fee structure. While access to the some contracts is often marketed as “free” to public agencies, the programs are funded by administrative fees paid by the contractors to the program manager.  In addition, owners can pay significant “contract management” and various “consulting fees”.
  • Cost Pass-Through: Contractors are typically required to pay a percentage-based fee on every task order. Industry analysis indicates that contractors routinely incorporate these fees into their “adjustment factors” (multipliers). Consequently, the public agency indirectly bears these administrative costs through higher project invoices.
  • Market Price Disconnection: Because the UPB is a generally a static industry standard, and/or a “market average cost database localized using location factors” it may not reflect the current, location specific labor, material, and equipment costs,  potentially resulting in a higher baseline cost for the owner.  The later can be address by using a dynamic, locally researched cost database.
4. Oversight Failures and Fiduciary Risks
Third-party audits of modern JOC implementations have identified recurring systemic failures that can undermine the fiduciary responsibility of public officials:
  • Systemic Control Gaps: Audits of various  JOC programs, primarily in the State, County, Municipal sectors,  have cited a “systemic lack of controls,” leading to environments where overpayments are common due to inadequate invoice review and associated poor management processes/practices.
  • Project Splitting: Reports have identified instances of “project splitting,” where large-scale construction jobs are divided into smaller task orders to stay below the legal dollar thresholds that would otherwise trigger mandatory board approval or open competitive bidding.
  • Structural Conflicts of Interest: Agencies frequently rely on the program manager/JOC Consultant to verify contractor quotes. Because the manager’s revenue is often tied to total project volume, a structural conflict exists that may disincentivize aggressive cost-cutting on behalf of the public owner.
  • UPB Non-Compliance: Audits have revealed that the Unit Price Book—the primary tool for cost transparency—is frequently bypassed in contractor proposals, leaving owners without a verifiable “receipt” for services rendered and making it difficult to ensure “best value.”
5. Challenges to Fiduciary Duty
The mandate of a public official is to ensure the prudent use of taxpayer funds. The reliance on “current market-leading JOC providers” often substitutes internal professional cost-estimation and management with a proprietary system that prioritizes volume and speed. Without independent, third-party validation of the prices and quantities being charged, an agency risks violating its fiduciary duty by delegating price-verification to a vendor whose fees increase in direct proportion to the project’s total cost.
6. Conclusion
While current market leading JOC frameworks provide an effective pathway for emergency repairs and routine maintenance, their application presents significant fiduciary risks. The convenience of accelerated procurement must be weighed against the potential for inflated costs and the erosion of direct oversight. Public agencies should maintain independent cost-estimation review and project management capabilities and conduct regular, independent audits to ensure that the “efficiency” of JOC does not result in the mismanagement of public funds.

References (Harvard Style)
4BT, (2021). Review of Municipal Job Order Contracting Audit Findings. [online] Available at: 4bt.us [Accessed 19 Dec. 2025].
City of Long Beach, (2020). Audit of Job Order Contracting Program. [online] Available at: www.longbeach.gov [Accessed 19 Dec. 2025].
New York City Office of the Comptroller, (2018). Audit Report on Job Order Contracting Oversight. [online] Available at: comptroller.nyc.gov [Accessed 19 Dec. 2025].
Public Procurement Authority, (2023). Best Practices in IDIQ and JOC Frameworks. [online] Available at: www.naspovaluepoint.org [Accessed 19 Dec. 2025].
Texas State Auditor’s Office, (2020). An Audit Report on Job Order Contracting at Selected Entities. [online] Available at: sao.texas.gov [Accessed 19 Dec. 2025].

Note:  All trademarks, logos, and brand names are the property of their respective owners. Their use does not imply endorsement, affiliation, or any relationship with the mark’s owner


Critical Evaluation of Modern Job Order Contracting

About Four BT, LLC (4BT)   www.4bt.us


We help to create environments where the best people come to do their best work. We all succeed together.

Join us as we pave the way toward a new future for public and private sector efficient project delivery.

4BT exclusively provides verifiable, objective, current, local market construction cost data organized using expanded CSI Masterformat and supporting technology.


-Estimate project costs comprehensively

Ensure budgets reflect the actual current local market labor, material, and equipment costs for successful project delivery.

-Create detailed and realistic project timelines

Identify key milestones, task dependencies, and critical paths.

-Minimize risks associated with delays and budget overruns

Provide a clear project roadmap and cost control mechanisms.

-Enhance resource allocation and utilization –

Align resources and scheduling with budget constraints.

Construction Cost vs. Price

Construction Cost vs. Price – Exclusively from Four BT, LLC: Enabling Transparent, Reliable Local Market Construction Costing

Four BT, LLC provides highly granular, locally validated cost data for construction (repair, renovation, maintenance, new build) projects. Unlike general price lists or cost indexes that rely on national averages, Four BT focuses on verifiable, market-specific data covering labor, materials, and equipment. This bottom-up approach allows for more accurate and transparent budgeting, particularly valuable in today’s environment where conditions and pricing vary widely across regions (Construction Specifications Institute, 2021).

By building costs from direct local inputs, Four BT’s data ensures that pricing reflects actual local market conditions rather than location factors or inflationary multipliers. This transparency helps project owners and contractors identify inefficiencies, reduce inflated estimates, and achieve meaningful savings—often ranging between 30–40% on projects (Four BT, 2024). Their methodology aligns with the principles of Job Order Contracting (JOC), emphasizing collaborative procurement and evidence-based costing (Cohen & Kaim, 2020).

Cost vs. Price: Understanding the Distinction

Aspect COST (Four BT Approach) PRICE (Traditional / Market)
Focus Real-time, locally researched unit costs for labor, materials, and equipment. Contractor’s charge including profit, risk, overheads, and contingencies.
Methodology Data collected from local suppliers, verified wage rates (e.g., Davis-Bacon schedules), and associated commerical construction productivity metrics. Based on experience, national averages, or commercial cost databases adjusted with location factors.
Transparency Fully traceable at the task or item level (CSI MasterFormat standards). Often opaque; includes bundling of markups without cost-level visibility.
Accuracy High — based on real transactions in specific markets. Moderate to Low — dependent on estimation heuristics or index adjustments.
Financial Impact Enables project owners to plan and budget more efficiently, reducing inflation of estimates. Increases project risk due to generalized or inflated cost assumptions.
Construction Cost vs. Price

How Four BT Adds Value

  • Data Precision: Aggregates verified, current, and locally relevant cost data.

  • Budget Accountability: Increases cost transparency across all project stakeholders.

  • Technology Integration: Accessible via digital platforms like 4BT OpenCOST(TM) and 4BT BENCHMARK ESTIMATOR(TM), providing powerful estimating and cost analysis tools.

  • Verified Local Wages: Aligns with public-sector standards such as the Davis-Bacon Act for fair labor compliance (U.S. Department of Labor, 2023), and/or prevailing local market wage rates.

In essence, Four BT empowers owners, facility managers, and builders to understand true construction costs—allowing them to challenge inflated market prices, strengthen financial governance, and achieve substantial cost efficiency across the project lifecycle.


Example Graphic: Difference Between Cost and Price

Title: How Cost Data Differs from Market Pricing

Price = Labor + Material + Equipment + Design/Builder Overhead and Profit

Cost  = Labor + Material + Equipment


References (Harvard Style)

  • Cohen, L. & Kaim, R. (2020) Collaborative Procurement Strategies in Job Order Contracting. Journal of Construction Procurement, 26(3), pp. 45–59.

  • Construction Specifications Institute (2021) MasterFormat: Construction Specifications Indexing Standards. Alexandria, VA: CSI.

  • Four BT, LLC (2024) OpenCOST Data Platform Overview. Available at: https://www.4bt.us (Accessed: 17 December 2025).

  • (Peitlock, B.A., (1998) Developing Location Factors Using a Factoring Method, International Cost Engineering Council, ICEC International Cost   Management Journal (ICMJ), “Location factors are used during preliminary project evaluations. They are not intended to be used when preparing appropriation-quality estimates. They often are applied to conceptual estimates for identifying “go/no-go” projects at an early stage.”

  • Martinez, A., (2010) Validation of methods for adjusting construction cost estimates by project location , University of New Mexico UNM “Location factors are primarily used in class 4 and 5 estimates and are not intended to be used for higher quality estimates, such as class 3, 2, or 1. The RSMeans city cost index (CCI) and the Department of Defense area cost factor (ACF) index are two primary examples of location factor publications.”

  •  Migliaccio, G. (2013) Empirical Assessment of Spatial Prediction Methods for Location Cost Adjustment Factors, J Constr Eng Manag. “Despite its potential weaknesses, estimation by adjustment factors is a very common approach for all types of construction. A very common approach for performing quick-order-of-magnitude estimates is based on using Location Cost Adjustment Factors (LCAFs). The accuracy of cost estimates in the early phases varies within an expected range that spans from -100% to +200%.”
    • University of Colorado Denver College of Engineering and Applied Science Department of Civil Engineering (2017) Validation of Project-level   Construction Cost Index Estimation Methodology,  “Problems within the methodology, unfortunately, will continue to arise as standardized estimation tools (CCI) simply cannot account for the unique characteristics of individual states.  Unfortunately, the accuracy of program-wide CCIs occasionally led to swings of ±20 percent after projects had gone through the bidding process. Additionally, no direct application of market or economic conditions existed in this conventional CCI process, which was theorized by FHWA to potentially be a significant influence on resulting project estimate accuracy. ”
  • U.S. Department of Labor (2023) Davis-Bacon Act Guidance for Federal Construction Projects. Washington, D.C.: USDOL.

Four BT, LLC provides granular, locally researched cost data (labor, materials, equipment) for construction, differing from general price lists by focusing on direct, verifiable local market realities rather than national averages or index factors, offering high accuracy for detailed project budgeting. building units costs from the ground up for transparency, helping owners and builders avoid inflated estimates, leading to significant savings (30-40%+) by separating costs from potentially inflated project prices.

In essence, Four BT helps you understand the true cost of construction elements, allowing you to manage budgets better and challenge inflated market prices, leading to mitigated, better project outcomes, and significant savings.
Request full WHITE PAPER

← Back

Thank you for your response. ✨

Note:  All trademarks, logos, and brand names are the property of their respective owners. Their use does not imply endorsement, affiliation, or any relationship with the mark’s owner.

Tracking Construction Spend Is Useless

Here is why Tracking Construction Spend Is Useless if done in isolation.

Tracking Construction Spend is Useless

The problem

Tracking spend alone provides no insight into efficiency, accuracy, or performance.

It only tells you what you paid — not what the job should have cost.

Spend without verified, granular cost data is hindsight: noisy, late, and often misleading. Cost data that is national, averaged, using location factors, or unstandardized is budgetary — but low-resolution foresight. Neither is enough to enable cost visibility or cost management.

  1. A contractor’s invoice is not a benchmark.
  2. A cost estimate without verified local unit costs is not analysis.
  3. Cost management requires reconciling and  validating the two.

What to measure (and why)

  1. Line-item local unit costs (materials, labor, equipment) — not just totals. Granularity enables apples-to-apples comparisons across jobs, vendors and time.
  2. Work classifications & standardized codes (CSI Masterformat, UniFormat) — standard taxonomy makes trend analysis and contractor benchmarking possible.
  3. Actual spend (invoices, change orders, T&M logs) mapped to the same line items and codes — reconciles intention vs outcome.
  4. Project context data (site, schedule, access, regulatory constraints) — costs can diverge wildly depending on site realities: capture context.
  5. Lifecycle & whole-life cost inputs — energy, downtime, recurring maintenance, and replacement cycles to inform repair vs replace decisions.

Requirements for cost data to be useful

To be action-grade (not just nice-to-have) your cost data must be:

  • Verifiable: traceable to primary sources (local labor costs for all individual trades, local material costs, equipment costs), not opaque “averages.”
  • Objective: Information attained by multiple sources and independently validated.
  • Granular: unit-line level (e.g., “2×4 lumber, 16d nails, install hr, crew”) to allow disaggregation and forensic analysis.
  • Standardized & codified: common taxonomy (CSI MasterFormat, Uniformat, Omniclass/ISO 55000 alignment) so you can roll up, slice and compare across portfolios.
  • Local market-specific: city/metro or even neighborhood adjustments based on current data, supplier quotes, etc. — location factors alone are insufficient for procurement-ready estimates.

Benefits — real, measurable, repeatable

  • Better procurement outcomes: With reliable local unit costs you can set aggressive, realistic RFPs and reduce low-ball bids that lead to change orders.
  • Improved repair vs replace decisions: Quantify when repair is a false economy. That’s how engineering teams move from instinct to evidence.
  • Reduced cost overruns and fewer surprises: When you reconcile pre-job costs to actual spend you discover systemic issues (poor estimating, scope creep, supply-market shifts, process/management issues) and fix them.
  • Faster, more defensible budgeting: CFOs and boards trust budgets grounded in verifiable local data — not national averages and hope.
  • ISO/asset management alignment: Standardized cost capture supports ISO 55000/55001 whole-life asset management workflows and auditability.

Three practical steps to implement this today

  1. Instrument your systems: Ensure your BIM/IWMS/CAFM/CMMS/ERP/Estimating tools share taxonomy and can attach invoices to unit line items and projects. If they don’t, fix the taxonomy first.
  2. Adopt verified local cost feeds: Combine a reputable cost library (that provides local unit data) with in-house captured spend to create a living benchmark — update quarterly. Be suspicious of “location factors” and/or “economic factors” used as a shortcut.
  3. Run rolling variance and lifecycle analyses: automate variance reports (planned cost vs actual spend at line-item level) and feed the results into repair/replace models and future bid guidelines.

 “Data quality checklist”

  • Verifiable (objectively and transparently sourced labor, material, equipment, and crew data)
  • Local (city/site researched)
  • Granular (unit line items)
  • Standardized (industry standard codes/taxonomy)
  • Updated (quarterly updates)

Summary

If your organization continues to budget and buy from averaged national data, and then accepts invoices as truth without reconciliation, you’re running a reactive process that invites overruns. Organizations that combine  spend capture, local verified unit cost libraries, and standardized taxonomies consistently outperform peers on budget accuracy, procurement outcomes and lifecycle optimization.

Put differently: traceable local cost data turns surprises into strategy.

References

Gordian / RSMeans (2024) Unlocking the Benefits of RSMeans Data Online. RSMeans.

Four BT, LLC (2023) Construction Cost Estimating, Location Factoring, and… Four BT. X

National Academies / Committee (n.d.) Federal Facility Asset Management Systems. National Academies Press.

WorkTrek (2025) How CMMS Helps in Managing Maintenance Costs. WorkTrek. Published June 30, 2025.

Oh, W.J. et al. (2023) ‘Life Cycle Cost Method for Safe and Effective Infrastructure Maintenance’, Buildings, 13(8), 1983. doi:10.3390/buildings13081983.

Note:  All trademarks, logos, and brand names are the property of their respective owners. Their use does not imply endorsement, affiliation, or any relationship with the mark’s owner.

About Four BT, LLC (4BT

We help to create environments where the best people come to do their best work. We all succeed together.

Join us as we pave the way toward a new future for public and private sector efficient project delivery.

4BT exclusively provides verifiable, objective, current, local market construction cost data organized using expanded CSI Masterformat and supporting technology.

-Estimate project costs comprehensively

Ensure budgets reflect the actual current local market labor, material, and equipment costs for successful project delivery.

-Create detailed and realistic project timelines

Identify key milestones, task dependencies, and critical paths.

-Minimize risks associated with delays and budget overruns

Provide a clear project roadmap and cost control mechanisms.

-Enhance resource allocation and utilization –

Align resources and scheduling with budget constraints.

Addenda

Why Local, Verifiable, Granular Cost Data Matters

  1. Local Market Conditions Drive 30–60% Variation

Labor rates, productivity, supplier pricing, and equipment availability vary significantly by city and region. National averages and cost factoring do not cover these variations effectively.

  1. Granular Unit Costs Create Transparency

A line-item unit price exposes what’s really happening — not just what the contractor reports in a lump sum.

  1. Standardization Enables Measurement

Using CSI Masterformat, UniFormat, OMNICLASS or other structured cost systems allows you to compare projects, years, contractors, and failure modes on equal terms.

  1. Cost + Spend Together Reveal Truth

When you reconcile planned cost (unit-based) against actual spend (invoice-based), you expose:

  • scope gaps
  • inefficiencies
  • pricing anomalies
  • misaligned procurement strategies
  • inflation impacts
  • contractor performance trends

Benefits to Owners and Facility Portfolios

  • Lower overall project costs through better benchmarking and fewer overpriced bids
  • Reduced change orders due to scope clarity and realistic pre-pricing
  • Faster, more defensible budgets
  • Improved repair/replace decisions using lifecycle cost comparisons
  • Greater transparency across contractors, regions, and asset classes
  • Higher accuracy in capital planning and forecasting

Organizations that adopt verifiable local cost data outperform those relying on spend, approximations, or national averages and/or location factoring.

The TRUTH about AI

The TRUTH about AI

Artificial Intelligence (AI) is often hailed as the next frontier ― a revolutionary force poised to transform creativity, productivity, and innovation. And yet: AI is only as powerful as the person using it.

“I don’t believe in peer review because I think it’s very distorted and as I’ve said, it’s simply a regression to the mean. I think peer review is hindering science. In fact, I think it has become a completely corrupt system”. – Nobel laureate Sydney Brenner

In practice, generative AI today behaves less like a creator and more like a sophisticated synthesizer of existing material — akin to a peer-reviewed paper summarizing decades of human knowledge, rather than inventing fresh scientific paradigms.

The TRUTH about AI

Why AI remains tethered to the status quo

  1. Dependence on historical data Contemporary AI models — whether large language models or generative-art tools — are trained on vast repositories of human-produced content. Their outputs derive from what already exists; they recombine, remix, and reframe, but seldom break entirely new ground.
  2. Lack of generative “imagination” or agency As argued in recent literature, AI lacks the human faculties of intention, judgment, or evaluative capability. It cannot choose to explore an “adjacent possible” beyond its training — it simply optimizes within known boundaries.
  3. Creativity ceiling Even where AI seems creative — writing essays, painting images, composing music — its “novelty” often comes at the cost of depth, uniqueness, or emotional substance. What emerges may look new; but meaning, context, and human insight are often missing.
  4. Risk of homogenization over innovationSome empirical studies suggest that while AI may boost individual output (especially for non-experts), the resulting content becomes more similar and less diverse across users — narrowing the overall spectrum of innovation.

What this means for us — and how we should treat AI

  • AI as amplifier — not originator. Think of AI as a powerful assistant: excellent for scaling, refining, summarizing, or exploring combinations. But for fundamentally new ideas, breakthroughs and genuine creativity still require human vision, curiosity, and critical thinking.
  • Human oversight is indispensable. Because AI lacks “understanding,” outputs must be evaluated, contextualized, fact-checked, and curated. Reliance on AI alone risks reinforcing existing biases, blind spots, or shallow thinking.
  • Intentional use — not blind faith. The quality and value of AI-generated output depend heavily on prompt design, domain context, and human judgment. The “right user” gets the most out of AI; the rest risk getting a polished mirage.

Conclusion

AI is neither magic nor replacement for human creativity and judgment. At its core, it remains a tool — powerful, yes, but fundamentally bound by the data, assumptions, and constraints embedded in its training.

Used wisely, it can amplify human ingenuity. Used carelessly, it can reinforce the status quo — and turn even mediocre ideas into superficially polished pieces.

So the next time someone calls AI “the future of creativity,” ask: who’s actually steering the ship? Because the answer matters.


About Four BT, LLC

We help to create environments where the best people come to do their best work. We all succeed together.

Join us as we pave the way toward a new future for public and private sector efficient project delivery.


  • Estimate project costs comprehensively – Ensure budgets reflect the actual current local market labor, material, and equipment costs for successful project delivery.
  • Create detailed and realistic project timelines – Identify key milestones, task dependencies, and critical paths.
  • Minimize risks associated with delays and budget overruns – Provide a clear project roadmap and cost control mechanisms.
  • Enhance resource allocation and utilization – Align resources and scheduling with budget constraints.

4BT Commerical Construction Cost Data

First and foremost, 4BT Commericial Construction Cost Data is unlike traditional sources of construction cost data.

Understanding true local construction costs remains a persistent challenge in project planning, procurement, and budgeting. Traditional cost books — for example RSMeans, BNI, and similar national-scale cost data providers — often rely on national average prices and location factors, which may support budgetary estimates but struggle to deliver the level of local market transparency required for procurement-ready use. Utilizing 4BT Commericial Construction Cost Data can bridge this gap effectively.

4BT Commercial Construction Cost Data is positioned as a response to this gap, aiming to deliver more accurate, location-specific information through detailed research and transparent methodology.

By integrating 4BT Commericial Construction Cost Data, project managers can enhance their budgeting accuracy and improve overall project outcomes.

Key Advantages

More representative local costs

4BT compiles labor, material, and equipment pricing through targeted local market research rather than relying on national averages. Traditional location multipliers can overlook regional wage variation and logistical realities—factors that may contribute to significant estimation differences in some markets. Traditional location factors, which are typically multipliers applied to national average costs, miss several critical nuances captured ground-up local market research. These omissions can lead to cost estimation errors of 30% to 40% or more in some cases. 

Granular and transparent line items

The database reportedly includes more than 90,000 individual construction task items organized according to an expanded CSI MasterFormat. This enables precise scoping, detailed cost development, and more defensible control over estimates.

Objectivity and auditability

Because the data is sourced and built from verifiable methods, it can be more defensible in public procurement, benchmarking and audit environments. This transparency may strengthen trust between owners, design teams, and contractors.  It also is in concert with public sector fiduciary and procurement requirements.

Current market reflection

4BT updates are issued quarterly, allowing for alignment with recent price changes—particularly relevant in volatile material and labor markets where annual updates may lag real-world conditions.

Alignment with collaborative delivery methods

The approach is intended to integrate with LEAN construction, Job Order Contracting (JOC), and Integrated Project Delivery (IPD), supporting reduced disputes and clearer expectations across stakeholders.

Trade-specific labor accuracy

Labor rates are based on prevailing or Davis-Bacon wage research across more than 130 trades. This can capture differences between, for example, electrical and mechanical labor costs, which single-factor regional multipliers may overlook. Material pricing also reflects real local supply chain considerations, including logistics and proximity to suppliers.

4BT Commercial Construction Cost Data

Conclusion

While traditional cost adjustment methods remain common for early concept budgeting, more detailed, locally validated research can provide greater precision and transparency for procurement and delivery. 4BT’s approach—grounded in granular cost data, frequent updates, and trade-specific labor insights—highlights why local market representation is becoming central to modern construction estimating practices.

References

4BT (2024) 4BT Commercial Construction Cost Data. Available at: 4bt.us (Accessed: 8 December 2025).

CSI (2020) MasterFormat 2020 Update. Construction Specifications Institute.

U.S. Department of Labor (2024) Davis-Bacon Wage Determinations. Washington, DC: US DOL.

Lean Construction Institute (2023) Lean Construction Overview and Principles. LCI Publications.


Note:  All trademarks, logos, and brand names are the property of their respective owners. Their use does not imply endorsement, affiliation, or any relationship with the mark’s owner.


About Four BT, LLC

We help to create environments where the best people come to do their best work. We all succeed together.

Join us as we pave the way toward a new future for public and private sector efficient project delivery.

  • Estimate project costs comprehensively – Ensure budgets reflect the actual current local market labor, material, and equipment costs for successful project delivery.
  • Create detailed and realistic project timelines – Identify key milestones, task dependencies, and critical paths.
  • Minimize risks associated with delays and budget overruns – Provide a clear project roadmap and cost control mechanisms.
  • Enhance resource allocation and utilization – Align resources and scheduling with budget constraints.

Request White Paper….

← Back

Thank you for your response. ✨


Are Lumber Prices Going Down?

Are Lumber Prices Going Down? Navigating Continued Instability

Are lumber prices going down

Lumber prices are currently exhibiting the instability that has characterized the market in recent years. After climbing to a 2025 peak of $665 per thousand board feet, prices remain higher than their lowest point in 2024. This trend highlights the ongoing volatility for consumers, contractors, and builders alike.
The Current Trend: Higher Than Last Year’s Low
Price remain high and unstable. As of December 2025, lumber futures are trading around $539.50 per thousand board feet (CME Group, 2025). This indicates a general oversupply in the market and soft demand, which has prevented a significant upward surge but hasn’t erased the gains from early 2025.
What the Forecasts Say: Brace for Instability
Industry forecasts universally predict continued instability in lumber pricing. This means that while prices aren’t necessarily on a one-way trip down, they are unlikely to remain static for long. Several factors contribute to this volatile outlook:
  • Supply Chain Fluctuations: Disruptions in logging, milling, and transportation—often driven by weather events or labor issues—can cause rapid price spikes.
  • Housing Market Sensitivity: Lumber demand is directly tied to new home construction and renovation projects. Any shifts in mortgage rates, housing starts, or consumer confidence can quickly impact pricing.
  • Economic Uncertainty: Broader economic factors influence construction activity.
The Bottom Line for Consumers and Builders
For anyone planning a project, the message is clear: flexibility is key.
  • Monitor Prices Closely: The price today may not be the price tomorrow.
  • Plan Ahead: If possible, purchase materials when prices are favorable for your budget.
  • Budget for Fluctuations: Be prepared for potential cost changes during the duration of a project.
The market remains dynamic, and while current prices offer some relief from the 2025 peak, the prediction of continued instability means that a sudden downward, or upward, shift is always a possibility.
Note:  4BT exclusively offers objective, verifiable, and dynamic locally researched granular construction cost data for owner and design/builder project estimating.

References
CME Group (2025) Lumber futures. Available at: CMEGroup.com (Accessed: 5 December 2025).
Country Concepts (2025) Hardwood pricing. Available at: CountryConcepts.com (Accessed: 5 December 2025).
The Home Depot (2025) Building materials pricing. Available at: HomeDepot.com (Accessed: 5 December 2025).
Lowe’s (2025) Lumber pricing. Available at: Lowes.com (Accessed: 5 December 2025).

About Four BT, LLC   www.4bt.us

We help to create environments where the best people come to do their best work. We all succeed together.

Join us as we pave the way toward a new future for public and private sector efficient project delivery.


  • Estimate project costs comprehensively – Ensure budgets reflect the actual current local market labor, material, and equipment costs for successful project delivery.
  • Create detailed and realistic project timelines – Identify key milestones, task dependencies, and critical paths.
  • Minimize risks associated with delays and budget overruns – Provide a clear project roadmap and cost control mechanisms.
  • Enhance resource allocation and utilization – Align resources and scheduling with budget constraints.


The Construction Black Hole

The construction black hole refers to a concept used to describe the issues and bottlenecks that cause delays and inefficiencies in the construction, and greater AECOO industry, particularly concerning the lack of robust and integrated Planning, Procurement, and Project Delivery.
The “construction black hole” concept highlights several systemic problems:
  • Preconstruction Failures: Critical foundational aspects of preconstruction, spanning the planning and procurement phases of any project have not been rigorously developed and consistently applied and/or required by real property owners.  This issue causes cascading inefficiencies  throughout project life-cycles.
  • Fragmented Communication: Poor communication channels between planners, designers, estimators, procurement professionals, builders, owners, users, and oversight groups are commonplace.  
  • Disparate, Unverified Information: Objective, verifiable, current, standardized, and current information is a basic requirement during all phases of any repair, renovation, maintenance, or new build project.   99% of all projects fail to use objective, verifiable, current, and standardized line-item construction task data replete with locally researched labor, material, equipment costs as well as productivity information.

Construction Black Hole

  • Owner Leadership: The phrase is used in the context of advocating for improved, proactive management of the built environment on the part of real property owners.   As owners “pay the bills”, they are ultimately responsible for how the “product” is delivered and maintained.  Without continuous, competent, and accountable real property owner leadership, measurable reduction of financial and environment waste endemic to the built environment will remain elusive. 

FM Productivity Issue

The author is a facilities lifecycle cost and total cost of ownership thought leader who has worked with firms like Four BT LLC, RS Means Company LLC, VFA, Inc, and 4Clicks Solutions, LLC. His work focuses on implementing collaborative construction planning and optimizing capital investments in physical infrastructure. 

References:

D’Amico, L., E. Saiz and H. Tarr, 2024. Why Has Construction Productivity Stagnated? The Role of Land-Use Regulation. [Online]. Harvard Business School. Available at: www.hbs.edu (Accessed: 7 December 2025).
The Economist, 2017. Efficiency eludes the construction industry. [Online]. Available at: www.economist.com (Accessed: 7 December 2025).
FMI Corp., 2023. Labor Productivity Study. [Online]. FMI. Available at: www.fmi.com (Accessed: 7 December 2025).
Goolsbee, A.D. and C. Syverson, 2023. The Strange and Awful Path of Productivity in the U.S. Construction Sector. [Online]. University of Chicago Booth School of Business. Available at: www.chicagobooth.edu (Accessed: 7 December 2025).
ITcon (Journal of Information Technology in Construction), various years. [Studies on technology adoption and project delays]. [Online]. Available at: www.itcon.org (Accessed: 7 December 2025).
McKinsey & Company, 2024. Delivering on construction productivity is no longer optional. [Online]. Available at: www.mckinsey.com (Accessed: 7 December 2025).
McKinsey Global Institute, 2017. Reinventing construction: A productivity revolution. [Online]. Available at: www.mckinsey.com (Accessed: 7 December 2025).
Townley, C. and R. Bryce, 2023. [Research on local pushback and regulatory environments affecting construction]. [Online]. American Enterprise Institute (AEI). Available at: www.aei.org (Accessed: 7 December 2025).
U.S. Federal Reserve Bank of Richmond, 2025. Five Decades of Decline: U.S. Construction Sector Productivity. [Online]. Available at: www.richmondfed.org (Accessed: 7 December 2025).
Various authors citing Goolsbee and Syverson’s research, 2024. [Analyses on lack of new equipment and declining skill levels]. [Online]. BuiltWorlds. Available at: builtworlds.com (Accessed: 7 December 2025).

Reach out to share your views?

← Back

Thank you for your response. ✨


About Four BT, LLC


We help to create environments where the best people come to do their best work. We all succeed together.

Join us as we pave the way toward a new future for public and private sector efficient project delivery.


  • Estimate project costs comprehensively – Ensure budgets reflect the actual current local market labor, material, and equipment costs for successful project delivery.
  • Create detailed and realistic project timelines – Identify key milestones, task dependencies, and critical paths.
  • Minimize risks associated with delays and budget overruns – Provide a clear project roadmap and cost control mechanisms.
  • Enhance resource allocation and utilization – Align resources and scheduling with budget constraints.


Third-Party JOC Issues

Third-party JOC issues include inherent and valid concerns regarding transparency, efficiency, and the potential for systemic waste and fraud.
ISSUE
While JOC is a valuable construction procurement method intended to expedite small to medium-sized repair, renovation, maintenance, and new construction projects, reliance on external consultants for program administration introduces vulnerabilities that real property owners must proactively address.
Independent audits frequently highlight these vulnerabilities when program administration and crucial cost data management are outsourced to third-party consultants. Reports from bodies like the Government Accountability Office (GAO) and the Department of Defense Inspector General (OIG) have pointed to significant issues, including a failure to adequately verify/validate local market costs and insufficient oversight.
The core issue. howevern, often stems from two primary factors: (1) the structure of administrative fees and(2) a failure in owner oversight.
(1) Administrative fees based upon JOC construction volume, while ostensibly covering management costs, can significantly impact the overall budget and inflate project costs. These fees sometimes create a scenario where the third party’s incentive structure is misaligned with the owner’s goal of achieving maximum value.
(2) Furthermore, a failure by the owner organization to adequately monitor these outsourced processes results in a lack of accountability and difficulty in ensuring both efficiency and program compliance.. This oversight failure opens the door for inconsistencies in how “unit price books” (UPBs) are maintained and applied, sometimes leading to inflated costs that do not accurately reflect the actual current local market rates for labor, material, and equipment.
SOLUTION
To mitigate these substantial risks, savvy owners are increasingly moving toward self-managed JOC models. This strategic shift involves the owner organization retaining direct control over the software platforms, data licensing, and daily program administration.
By managing the process in-house, owners can enhance transparency, ensure strict adherence to procurement policies, and robustly audit costs internally. This approach directly addresses concerns about potential systemic waste and allows organizations to manage project costs comprehensively, ensuring budgets truly reflect accurate, current local market conditions for successful project delivery.
A self-managed model empowers owners to create detailed and realistic project timelines with complete visibility into key milestones, task dependencies, and critical paths. This internal control minimizes risks associated with delays and budget overruns by providing a clear project roadmap and direct cost control mechanisms. Ultimately, enhancing resource allocation and utilization is streamlined when scheduling and budget constraints are managed internally by a dedicated team aligned entirely with the owner’s mission.

References
[1] Auditing a procurement vehicle for construction services: A guidebook for public owners. National Association of State Auditors, Comptrollers and Treasurers (NASACT) JOC Best Practices Report, 2017.
[2] Beard, M. A. An analysis of the use and effectiveness of job order contracting in public organizations. Journal of Public Procurement, 14(2), 231-255, 2014.
[3] Office of the Inspector General (OIG). Audit Report: Opportunities exist to improve oversight and reduce costs in Army Corps of Engineers’ Job Order Contracts. Department of Defense, Report No. DODIG-2016-105, 2016.
[4] General Accountability Office (GAO). Federal contracting: Observations on the use of job order contracts. Testimony before the Committee on Small Business, House of Representatives, GAO-08-410T, 2008.
Third-Party JOC Issues

About Four BT, LLC

We help to create environments where the best people come together to do their best work. We all succeed together.

Join us as we pave the way toward a new future for public and private sector efficient project delivery.

  • Estimate project costs comprehensively – Ensure budgets reflect the actual current local market labor, material, and equipment costs for successful project delivery.
  • Create detailed and realistic project timelines – Identify key milestones, task dependencies, and critical paths.
  • Minimize risks associated with delays and budget overruns – Provide a clear project roadmap and cost control mechanisms.
  • Enhance resource allocation and utilization – Align resources and scheduling with budget constraints.
Learn more….

← Back

Thank you for your response. ✨

JOC Program Value

Have you recently reviewed your JOC Program Value?

The Problem: It is a consistent finding in audits and expert analysis that a lack of robust oversight by public agencies is a persistent and systemic issue in the management of Job Order Contracting (JOC) programs.  (see listing of independent JOC audits)

Assuming the above is the case, the JOC model as implemented with volume-based fees (“JOC Consultant Model” or “JOC Services” Model) and effectively outsourcing of key services that should be owner-provided, is fundamentally high-risk and potentially unviable for responsible public procurement.

Solution – If you accept that JOC can work: JOC is intended to be a compliant project planning,  procurement and project delivery method that provides efficiency while still adhering to public procurement laws and ensuring fiduciary responsibility on the part of owners. Robust oversight is a legal necessity for any public contract.

#1 Owners can/must manage their own JOC programs and depend upon vendors to provide adequate training and tools for self-management and eliminate third-party conflict of interest.

#2 Owners must prioritize building the internal capacity and independent controls necessary to manage the JOC program, potentially adopting models that remove third-party conflicts of interest.

#3 The documented history of audit findings suggests that simply relying on a third-party vendor’s “expertise” without the public agency investing in its own rigorous, independent oversight is an insufficient risk mitigation strategy.

Food for thought:  The effectiveness of any JOC Program is entirely dependent on the foundational frameworks and cultural practices surrounding its use. That said, a sole focus upon speeding procurement, or simply accelerationg and digitizing existing, broken processes with technology provides limited value and in fact can be a source of significant waste.

Genuine, measurably industry improvement and sustainability requires real property owner leadership, capacity, and accountability.

JOC Program Value

The documented history of audit findings suggests that simply relying on a third-party vendor’s “expertise” without the public agency investing in its own rigorous, independent oversight is an insufficient risk mitigation strategy.

About Four BT, LLC

We help to create environments where the best people come to do their best work. We all succeed together.

Join us as we pave the way toward a new future for public and private sector efficient project delivery.

  • Estimate project costs comprehensively – Ensure budgets reflect the actual current local market labor, material, and equipment costs for successful project delivery.
  • Create detailed and realistic project timelines – Identify key milestones, task dependencies, and critical paths.
  • Minimize risks associated with delays and budget overruns – Provide a clear project roadmap and cost control mechanisms.
  • Enhance resource allocation and utilization – Align resources and scheduling with budget constraints.

← Back

Thank you for your response. ✨

Origins and Evolution of Lean

Historical Origins and Evolution of Lean Construction & Manufacturing   (Download PDF)

Cholakis, P.             Four BT, LLC – 2025  www.4bt.us

PreIndustrial Foundations

Era

Practice/Concept

Lean Connection

Ancient Rome / Egypt

Monumental infrastructure (roads, aqueducts, temples)

Centralized leadership, standardization, logistics planning

Venetian Arsenal

(~1100s1700s)

Shipbuilding using modular parts, assembly-line methods, standardized workflow

Early form of flow production, reduced waste, time certainty

Middle Ages – Master Builder System

Integrated leadership over design and construction

Similar to IPD and collaborative delivery, long-term knowledge retention

Medieval Guilds

Collective craft knowledge, quality standards, apprenticeship

Respect for people, standardization, continuous improvement

Adam Smith

(1776)

Division of labor

Efficiency through specialization

Eli Whitney

(1799)

Interchangeable parts in manufacturing

Standardization and quality control foundations

Industrial Revolution to Early 20th Century

Period

Contribution

Lean Connection

Frederick Taylor

(1890s)

Scientific management

Work standardization (but lacked respect for labor)

Period

Contribution

Lean Connection

Frank  & Lillian

Gilbreth

Time-motion studies

Flow and task optimization

Henry Ford (1913)

Assembly line manufacturing

Flow, pull, takt time—but inflexible

Toyota and the Formalization of Lean

Year

Milestone

Description

1930s

1950s

Toyota Production System

(TPS)

Pull systems, Just-in-Time, waste  elimination, continuous improvement, respect for people

1950s

1980s

W. Edwards Deming teaches statistical quality control in Japan

Laid foundation for Lean’s quality focus

1988

“Lean” coined by John Krafcik at

MIT

1990

The Machine That Changed the

World

Spread Lean Manufacturing globally

1996

Lean Thinking by Womack & Jones

Introduced 5 Lean principles

Emergence of Lean Construction

Year

Milestone

Description

1993

International Group for Lean

Construction (IGLC) formed

Collaborative academic-industry research

1997

Last Planner System introduced

Increases planning reliability, reduces variation

1999

Lean Construction Institute (LCI)

founded

Advocates Lean delivery practices

2000s

BIM, prefabrication, IPD integrated into Lean

Digital tools + Lean thinking

2005

2015

Alliance contracting grows in

Australia, UK

Emphasizes shared risk/reward, joint governance, target cost

2010s

2020s

Collaborative Job Order Contracting (JOC) gains momentum

Combines prepriced unit tasks with early contractor involvement, transparency, shared goals, and local cost visibility

2020s

IPD and Collaborative JOC increasingly recognized as LEAN frameworks, not just delivery tools

Emphasize early collaboration, trust, cost transparency, continuous improvement

Where Collaborative JOC and Alliance Partnering Fit in the Lean Framework

Method

Description

Lean Principles

Collaborative Job Order Contracting (JOC)

A long-term,  performance-based contract using locally validated cost books, integrated planning, continuous scope refinement, and mutual accountability

– Waste reduction via preplanning

– Flow reliability

– Cost transparency

– Early collaboration

– Respect for stakeholders

Alliance Contracting / Partnering

Common in Australia/NZ and the UK, it involves joint risk-sharing, no-blame culture, and target-cost delivery

– Shared value creation

– Joint continuous improvement

– Collaborative

Full Circle: Ancient Practices → Modern Lean Tools

Ancient Practice

Modern Equivalent

Master Builder

IPD, Collaborative JOC, Design-Build

Guild Apprenticeships

Continuous improvement / Lean training

Venetian Arsenal

Flow production / modular prefabrication

Cooperative governance (guilds)

Alliance Partnering / Integrated teams


← Back

Thank you for your response. ✨

About Four BT, LLC
We help to create environments where the best people come to do their best work. We all succeed together.
Join us as we pave the way toward a new future for public and private sector efficient project delivery.
• Estimate project costs comprehensively – Ensure budgets reflect the actual current local market labor, material, and equipment
costs for successful project delivery.
• Create detailed and realistic project timelines – Identify key milestones, task dependencies, and critical paths.
• Minimize risks associated with delays and budget overruns – Provide a clear project roadmap and cost control mechanisms.
• Enhance resource allocation and utilization – Align resources and scheduling with budget constraints.
NOTE: All trademarks and rights remain with their respective owners and no endorsements of any kind are implied or given.

Unit Cost Benchmarking – Commercial Construction

The combination of unit cost benchmarking and systems-thinking can yield dramatic reductions if both financial and economic waste spanning all aspects of built environment lifecycle management.

Process Transformation

  • Objective, verifiable, locally researched granular repair, renovation, maintenance, and new cost data organized using standard data architectures, terms, and definitions.  (Note:  Market average cost data and the use of location factoring is not a viable substitute.)
  • Consistent application of robust,  systems-thinking based Planning, Procurement, and Project Delivery process frameworks – Standardized processes and data
  • Intelligent sourcing
  • Focus upon long-term mutually beneficial relationships between owners, products and services providers, and the community
  • Development and monitoring of quantitative performance indicators
  • Continuous, competent and accountable governmental and real propery owner leadership


Cross-functional approach

The of standardized cost data through integrated, interoperable services, to deliver cross-domain insights enables evidence-based decision-making.


Unit Cost Benchmarking Unit Cost Benchmarking

4BT exclusively provides local market cost data, tools and services to enable verifiable project costing, superior cost visibility, and superior cost management capability.

  • Improve Project Control: Gain local market labor, material, equipment and productivity visibility to manage projects proactively from day one.
  • Enhance Decision Making: Make informed decisions based on realistic, verifiable cost projections and time requirements.
  • Reduce Delays and Overruns: Mitigate change orders to prevent project delays and cost overruns.
  • Better Resource Utilization: Allocate resources efficiently to optimize productivity and reduce waste.
  • Increase Stakeholder Confidence: Transparent proposals and  reporting builds trust among owner and design-builder project teams.
  • Scalable Solutions: Secure cloud technology hosted on Microsoft Government Cloud Environment.  CMMC-LvL 2 compliant for DoD applications.

Project Delivery Methods Comparision FM Alignment and Buy-In


Unit Cost Benchmarking
commerical cost

Sustainable Construction Prerequisites & Systems-Thinking Application

References:

#1. – “Location factors are used during preliminary project evaluations. They are not intended to be used when preparing appropriation-quality estimates. They often are applied to conceptual estimates for identifying “go/no-go” projects at an early stage.” (Peitlock, B.A., ccc, Developing Location Factors Using a Factoring Method, International Cost Engineering Council, ICEC International Cost   Management Journal (ICMJ), 1998.)

#2. Location factors are primarily used in class 4 and 5 estimates and are not intended to be used for higher quality estimates, such as class 3, 2, or 1. The RSMeans city cost index (CCI) and the Department of Defense area cost factor (ACF) index are two primary examples of location factor publications. (Martinez, A., Validation of methods for adjusting construction cost estimates by project location , University of New Mexico UNM   Digital Repository, 2010)

#3. “Despite its potential weaknesses, estimation by adjustment factors is a very common approach for all types of construction. A very common approach for performing quick-order-of-magnitude estimates is based on using Location Cost Adjustment Factors (LCAFs). The accuracy of cost estimates in the early phases varies within an expected range that spans from -100% to +200% ” “Using the results of this study, various commercial entities (e.g., RS Means) could enhance their online tools by uploading publicly available socio-economic variables and allowing users to perform geostatistical analysis. As a result, a cost engineer could input the location of a project and obtain the most accurate location adjustment factor through a mix of interpolation and geostatistical prediction techniques.” (Migliaccio, G., Empirical Assessment of Spatial Prediction Methods for Location Cost Adjustment Factors, J Constr Eng Manag. 2013)

#4. “Problems within the methodology, unfortunately, will continue to arise as standardized estimation tools (CCI) simply cannot account for the unique characteristics of individual states.  Unfortunately, the accuracy of program-wide CCIs occasionally led to swings of ±20 percent after projects had gone through the bidding process. Additionally, no direct application of market or economic conditions existed in this conventional CCI process, which was theorized by FHWA to potentially be a significant influence on resulting project estimate accuracy. ”    (University of Colorado Denver College of Engineering and Applied Science Department of Civil Engineering, Validation of Project-level   Construction Cost Index Estimation Methodology, 2017)

Proactive Preventive Maintenance – FM

Proactive Preventive maintenance (PM) is widely recognized as one of the most effective strategies for controlling facility operating costs, improving reliability, and extending asset life cycles. When combined with structured cost data and modern maintenance management systems, proactive preventive maintenance supports more accurate budgeting, better risk management, and stronger return on investment than reactive approaches.​

Strategic Role of Proactive Preventive Maintenance

Preventive maintenance replaces a “run‑to‑failure” mindset with planned inspections, servicing, and part replacements that address minor issues before they escalate into major failures. Studies indicate that organizations can reduce maintenance and facility operations costs by roughly 12–18% by shifting from reactive to preventive maintenance. This reduction reflects fewer emergency repairs, lower overtime labor, and decreased production or service disruption.​

The financial impact of PM is not limited to direct repair savings. Research on large portfolios has shown that robust preventive maintenance programs can yield very high returns on investment, with one telecom‑focused study reporting an average ROI of more than 500% when reductions in failure costs, energy use, and premature capital replacement are included. Such results highlight that PM is best viewed as a capital‑protection and risk‑mitigation strategy rather than a discretionary operating expense.​

Cost Management Benefits

From a cost‑management perspective, preventive maintenance contributes value in several interrelated ways:

  • Avoided costly repairs and downtime: Proactive inspections and scheduled interventions help identify wear, misalignment, and incipient failures, cutting the frequency and severity of unplanned outages and the premium costs associated with “break‑fix” maintenance.​

  • Extended asset life cycles: Regular servicing and adherence to manufacturer recommendations can extend equipment life by 20–40% in some applications, deferring major capital expenditures and smoothing long‑term renewal cash flows.​

  • Improved efficiency and energy performance: Well‑maintained systems—especially HVAC, rotating equipment, and process lines—tend to consume less energy and operate closer to design efficiency, reducing utility costs and associated emissions.​

  • Better budget predictability: Planned PM work can be forecasted and scheduled, enabling maintenance and finance teams to replace volatile emergency spending with more stable, pre‑budgeted maintenance programs.​

CMMS Capabilities and Gaps

Computerized Maintenance Management Systems (CMMS) are now a standard enabler of PM programs, providing tools to schedule tasks, generate and close work orders, track labor and material usage, and report on performance. Many CMMS platforms allow users to set “planned” or “estimated” costs for work orders, then capture “actual” costs so that variances and trends can be analyzed over time. Vendors commonly highlight features such as labor‑time tracking, material cost capture, and cost‑by‑asset reporting to support maintenance budgeting and cost control.​

However, a consistent gap across general‑purpose CMMS products is the absence of an embedded, independently researched, local‑market cost database for preventive‑maintenance tasks. Planned costs are usually derived from:

  • Historical averages from prior work orders (e.g., typical hours and parts usage).

  • User‑entered estimates based on internal experience or ad‑hoc calculations.

What these systems typically do not provide is a vendor‑supplied cost book of granular PM unit costs—labor, material, and equipment—benchmarked to local markets and maintained as a standalone data product. As a result, CMMS is excellent at storing, organizing, and analyzing cost data, but weak as an objective source of baseline PM unit pricing.

Role of Granular PM Cost Databases (4BT Example)

Specialized cost‑data providers have emerged to fill this gap by offering preventive‑maintenance cost databases built from local‑market research, often similar in structure to detailed construction cost books. One example is 4BT’s preventive maintenance cost database, which provides granular unit costs for labor, materials, and equipment for a wide range of PM tasks, derived from market‑sourced data rather than internal history. This kind of database allows maintenance planners to:​

  • Price PM work packages using consistent, documented unit costs.

  • Build service level–specific PM programs and budgets grounded in external benchmarks.

  • Compare internal performance and vendor proposals against an objective cost baseline.

4BT explicitly positions its PM database for “simple integration into CMMS software or other maintenance systems,” enabling organizations to feed market‑based unit costs into existing planning and work‑order structures. In practice, this means that for each PM task (e.g., quarterly air‑handler inspection), a corresponding cost line item can be selected from the database and associated with the CMMS task template, generating a defensible planned cost before any work history exists.​

proactive preventive maintenance

CMMS Integration and Data Strategy

Experience with CMMS deployments has shown that many initiatives underperform because they lack reliable baseline data, particularly on costs and asset condition. 4BT and others argue that without objective cost data, CMMS becomes a sophisticated logging tool rather than a decision‑support platform, leaving maintenance leaders exposed to inconsistent estimates and weak business cases for investment. To “mitigate risks” associated with such implementations, they advocate pairing CMMS with verified cost databases and structured asset‑data standards.​

Several CMMS vendors now provide integration guides and APIs that allow external data sources to be connected, opening the door to importing PM unit‑cost data from third‑party providers. MaintainX, for example, offers guidance on integrating external systems and data feeds so that costs and other reference data can be synchronized with work‑order and asset records. This integration‑first approach supports a more mature maintenance‑data strategy in which:​

  • CMMS manages workflow, execution, and historical records.

  • External cost databases provide market‑based planned costs and benchmarks.

  • Analytics tools combine planned, actual, and performance data to support governance, contracting, and portfolio‑level capital planning.

Synthesis: A Data‑Driven PM Framework

A high‑performing preventive‑maintenance framework for cost management brings together three elements:

  1. Preventive maintenance program design – Asset‑criticality analysis, risk‑based PM tasking, and schedules built around failure modes, regulatory requirements, and production constraints.​

  2. Execution and control via CMMS – Digital work management, planned vs. actual tracking, KPI dashboards, and audit trails to demonstrate compliance and support continuous improvement.​

  3. Objective cost baselines from granular databases – Local‑market PM unit costs used to construct budgets, evaluate vendor pricing, and quantify the benefits of reliability investments, rather than relying solely on historical internal averages.​

General CMMS vendors provide strong support for the second element but do not, at present, appear to own comprehensive local‑market PM cost databases. External cost‑data products, such as the 4BT preventive maintenance cost database, therefore play a complementary role: they provide the “planned” side of planned‑vs‑actual analysis, while the CMMS captures real‑world execution data, and the preventive‑maintenance program design ensures that both are aligned with operational risk and performance objectives.​

NOTE: All trademarks and rights remain with their respective owners and no endorsements of any kind are implied or given.


References (Harvard style)

Coast (2024) Preventive maintenance cuts facility operations costs by almost 20%. Available at: https://coastapp.com/blog/preventive-maintenance-facility-operations/ (Accessed: 23 November 2025).

Honeywell (2025) The benefits of preventive maintenance in 2025 and beyond. Available at: https://www.honeywell.com/us/en/news/featured-stories/2025/06/preventive-maintenance-benefits (Accessed: 23 November 2025).

Infraspeak (2024) Maintenance statistics and trends 2025. Available at: https://blog.infraspeak.com/maintenance-statistics-trends-challenges/ (Accessed: 23 November 2025).

Micromain (2024) Research shows preventive maintenance produces a ROI of 545%. Available at: https://micromain.com/preventive-maintenance-study/ (Accessed: 23 November 2025).

NIST (no date) The costs and benefits of advanced maintenance in manufacturing. Available at: https://nvlpubs.nist.gov/nistpubs/ams/NIST.AMS.100-18.pdf (Accessed: 23 November 2025).

Oxmaint (2025) How preventive maintenance boosts your bottom line by 12–18%. Available at: https://oxmaint.com/blog/post/how-preventive-maintenance-boosts-your-bottom-line- (Accessed: 23 November 2025).

UpKeep (2024) Maintenance statistics: predictive & preventive, labor & costs. Available at: https://upkeep.com/learning/maintenance-statistics/ (Accessed: 23 November 2025).

Verdantis (2025) 15+ powerful preventive & predictive maintenance statistics. Available at: https://www.verdantis.com/predictive-and-preventive-maintenance-statistics/ (Accessed: 23 November 2025).

Worktrek (2025) The true cost of maintenance: statistics & insights. Available at: https://worktrek.com/blog/maintenance-cost-statistics/ (Accessed: 23 November 2025).

4BT (no date) Preventive maintenance cost database. Available at: https://4bt.us/preventive-maintenance-cost-database/ (Accessed: 23 November 2025).

4BT (no date) CMMS / FM failure. Available at: https://4bt.us/cmms-fm-failure/ (Accessed: 23 November 2025).

MaintainX (no date) CMMS integration guide. Available at: https://www.getmaintainx.com/blog/cmms-integration-guide/ (Accessed: 23 November 2025).

Construction Cost Transparency is not optional

Construction Cost Transparency is not optional for real property owners, architects, builders, or oversight groups.

In today’s volatile construction environment, cost transparency is no longer a luxury — it is a necessity. For real property owners, architects, builders, and oversight groups, relying on generic “market average” cost data obscures real risk, erodes trust, and undermines effective decision‑making. Objective, current, and granular local‑market cost data offer markedly superior cost visibility compared to broad national averages adjusted by location factors, historical cost indexes, or time-based escalation.


Why Cost Transparency Matters

  1. Aligning Expectations & Trust
    Without clear line‑item visibility, stakeholders cannot verify how unit costs are derived. Granular cost data — including labor, materials, and equipment — allow owners and designers to trace cost drivers and hold contractors accountable. This transparency fosters trust and mitigates adversarial relationships. As Four BT argues, “relying on national average data plus a location factor … leads to 30–40% pricing errors” compared to locally researched data.  Construction Cost Transparency
  2. Risk Management & Cost Certainty
    Construction markets are dynamic: material prices, labor availability, and productivity fluctuate rapidly. Traditional cost indices (e.g., city cost indexes) are often slow-moving and cannot capture real-time changes. Using up-to-date, locally researched cost data helps project teams adjust early, manage contingencies, and negotiate contracts more effectively.

  3. Better Decision-Making & Design Optimization
    With granular data, architects and owners can compare alternative systems (e.g., modular vs. traditional construction) or materials (steel, wood, prefabrication) based on actual local pricing—not on averaged or indexed assumptions. This level of resolution supports value engineering in a way that generic data cannot.

  4. Avoiding Systemic Cost Overruns
    Empirical research underscores that underestimation remains a pervasive issue in public projects. Bent Flyvbjerg and colleagues demonstrate systematic bias in cost forecasting, concluding that underestimates are not purely errors but often “strategic misrepresentations.” Transparent, verifiable cost data reduce this risk by grounding estimates in reality.

  5. Improving Oversight & Accountability
    For oversight bodies (e.g., governance boards, funders, regulators), detailed cost data enable independent verification and benchmarking. This capability is essential for due diligence, particularly in publicly funded or mission-critical construction projects.

construction cost transparency


Challenges & Considerations

  • Scope Definition: Even granular data cannot substitute for a well-defined project scope. Errors in scope (e.g., omitted work, vague specifications) remain a primary driver of cost overrun.

construction cost transparency

  • Integration With Process: For transparency to matter, cost data must link into processes (estimating, design, procurement) using standardized frameworks (e.g., CSI MasterFormat) so all stakeholders “speak the same cost language.”

  • Regular Updates: Because local markets can shift quickly, cost‑data sources must be updated frequently to remain relevant. Quarterly updates, for example, help maintain alignment with real-world pricing.

  • Cost Certainty Timing: Owners must engage builders and subcontractors early in design to lock in real costs; late engagement undermines cost transparency and increases uncertainty.


Conclusion

Cost transparency in construction is non-negotiable. Relying on generic averages or lagging index data exposes owners, architects, builders, and regulators to hidden risk, adversarial relationships, and budget blowouts. In contrast, objective, current, granular local-market cost data establish a shared, verifiable, and realistic cost baseline — enabling informed decision-making, trust, and better cost management.

Stakeholders who demand and integrate this level of transparency position themselves to make smarter investments, reduce waste, and deliver more predictable, high-quality outcomes.


References

  • Flyvbjerg, B., Skamris Holm, M., & Buhl, S. L. (2013). Underestimating Costs in Public Works Projects: Error or Lie? Transportation Research Record.

  • Western Michigan University, Civil & Construction Engineering (2024). Forecasting Construction Cost Indices: Methods, Trends, and Influential Factors. Buildings, 14(10), 3272.

  • AIA (2017). Construction Costs: Identifying Factors That Influence Building Cost. AIA Educational Practice Committee.

  • Hibernian Cost Consulting. (n.d.). 5 Critical Factors That Impact Construction Cost Estimating Accuracy.

  • Four BT, LLC. (n.d.). Granular Local Market Cost Data is Essential for Construction Cost Visibility & Management.

  • Four BT, LLC. (n.d.). Construction Cost Reliability and Transparency.

← Back

Thank you for your response. ✨

CMMS FM Failure

The CMMS FM failure is rate widely accepted to be 70% to 80%.   

That’s a high percentage of CMMS implementations failing to meet expectations or deliver their promised value, including verifiable cost savings.

While the most powerful “market leading” platforms excel at managing, tracking, and analyzing cost information based on the data they are given,  offering high flexibility in how this data is structured (including WBS configuration for CSI MasterFormat) and extensive visibility through analytics, they do not include a built-in, universal database of objective, granular local market cost data for labor, materials, equipment, and productivity.

Users are responsible for inputting or integrating this specific, localized data, either manually or via integration with specialized external cost-estimating databases, to achieve “true cost visibility” in that specific sense. As we all know building a maintaining a verfiable, objective, well organized COST database is nontrivial, even in the world of AI.

Unfortuanately many/most FMers do not understand the criticality of comparing costs to market prices (quotes). Without COSTS, cost visibility and cost management are impossible.

The primary reasons CMMS systems fail to provide a return on investment (ROI) and verifiable cost savings in the FM sector boil down to PEOPLE and PROCESSES and INFORMATION, not technology.  At issue is the fact that TECHNOLOGY is rarely a solution, however, it can only automate and monitor established processes and proceedures.
Top reasons for CMMS FM Failure:
  • Lack of Planning and Clear Objectives: Many organizations implement a CMMS without a clear strategy or defined, measurable goals (e.g., “reduce emergency repairs by X%”). Without a destination, it is impossible to know if you’ve arrived or measure the savings.
  • Poor Data Quality and Input: The CMMS is only as good as the data entered into it. Inaccurate, incomplete (Lack of accurate cost information for Preventive Maintenance (PM) and associated tasks), or inconsistently formatted data (e.g., asset lists, maintenance history, spare parts inventory) leads to unreliable reports and bad decision-making.
  • Insufficient User Adoption and Training: This is often cited as the single most common reason for failure. If technicians and staff are not involved in the selection process, inadequately trained, or resistant to changing from paper-based systems, they simply won’t use the new system consistently, undermining its potential benefits.
  • Lack of Management Support: When leadership views the CMMS as a “tech project” rather than an operational transformation, the initiative often loses traction and necessary ongoing support and resources.
  • “Do-It-Yourself” Implementation and Scope Creep: Attempting a complex implementation without professional help or trying to use every feature/module at once can overwhelm teams and lead to haphazard results.
  • Failure to Establish Standard Processes: A CMMS works best when it enhances an already mature process, not when it is used to fix broken workflows or a purely reactive maintenance culture. The software provides the structure, but the organization must provide the standardized operating procedures.
  • Complexity: Systems that are not intuitive or require too many steps to complete basic tasks (like closing a work order) can alienate users and lead to poor adoption rates. 
Ultimately, a CMMS is a powerful tool for enabling proactive, data-driven maintenance strategies like preventive maintenance, which are proven to reduce costs. However, without a solid foundation of planning, data integrity, user buy-in, and process discipline, even the best software will fail to deliver its expected ROI. 
Lack of accurate cost information for Preventive Maintenance (PM) and associated tasks is a significant contributing factor to the high failure rate of CMMS systems in delivering verifiable cost savings. Without this critical data, facility managers cannot demonstrate the return on investment (ROI) because they cannot accurately compare the cost of proactive maintenance versus the much higher cost of reactive maintenance.
The Impact of Missing PM Cost Data
The absence of reliable cost information creates several analytical and operational blind spots:
  • Inability to Perform a True Cost-Benefit Analysis (CBA): You can’t perform an accurate CBA if you don’t know the specific labor, parts, and materials costs for PM tasks. This makes it impossible to definitively prove that “an ounce of prevention is worth a pound of cure” in a financial report to management.
  • Difficulty Justifying the PM Program: Without hard numbers showing that planned maintenance reduces expensive emergency repairs, it’s difficult to justify the budget and resources allocated to the PM program to leadership, who often view maintenance as a pure cost center.
  • Skewed Performance Metrics: If the true costs of reactive maintenance (e.g., premium overtime rates, expedited parts shipping, extended downtime) aren’t captured and compared against the PM costs, the performance of the maintenance team and the CMMS itself is inaccurately represented.
  • Poor Decision Making: Managers cannot identify which assets are truly “problem assets” or which PM frequencies are most cost-effective without accurate cost data. Decisions about whether to repair or replace equipment are based on intuition rather than data-driven financial analysis.
  • Underestimation of Total Savings: Organizations often track only obvious costs like parts and labor, over/underestimating total maintenance expenses by 35-45%+. This leads to inaccurate ROI projections that don’t reflect the actual value delivered by the CMMS and PM program and financial waste.
🛠️ Challenges in Tracking PM Costs
The difficulty in obtaining this information stems from:
  • Manual Tracking Inefficiencies: When work orders are tracked manually or inconsistently, hours worked, specific parts used, and associated costs are often missed, duplicated, or estimated poorly.
  • Lack of Integration: If the CMMS is not fully integrated with other systems like accounting/ERP or inventory management, costs are siloed and not reflected in a unified view.
  • No Common Data Environment: A failure to establish standard definitions and consistent methods for tracking costs across the organization makes it nearly impossible to aggregate and analyze the data effectively, such as a robust objective PM cost database.
By failing to leverage actual cost information, facility managers deprive themselves of the a ability to determine cost effectiveness of CMMS programs and technology.
CMMS FM Failure
Facilities Maintenance Maturity Model

← Back

Thank you for your response. ✨

CMMS FM Failure

1️⃣ Define and calculate PM costs

2️⃣ Estimate regular maintenance

3️⃣ Estimate unscheduled tasks

4️⃣ Monitor expenditure

5️⃣ Analyze deviations and implement corrections.

Facilities PM Cost Management

⭐ Improve facilities, systems, and component availability and improve life-cycle cost management.
⭐ Gain true cost visibility for your local market preventive maintenance requirements, including labor and material details.
⭐ Better prepare PM schedules and labor requirements.
⭐ Validate bids/proposals from PM services providers.
⭐ Access checklists for each system and associated time-based event, based upon industry standards.
⭐ Improve compliance and monitoring for both operations in-house and outsourced.
⭐ Determine the total PM cost for a facility based upon your inventory list.

Objectively LINK Cost and Schedule Data to Projects

Does your organization Objectively link Cost and Schedule data to Projects?

Abstract

Many organizations treat cost and schedule as separate streams of information.

Budgeting, procurement, planning, and project delivery teams often use different datasets, assumptions and update cycles — producing avoidable rework, cost overruns and schedule slippage. This article explains the practical and theoretical consequences of failing to objectively link cost and schedule data to project scopes, and describes how a current,verified, locally researched cost dataset (such as 4BT’s local market cost database) combined with tight collaboration between planning, procurement and project delivery teams creates measurable value: improved transparency, better risk allocation, faster decision making, and more reliable execution.


1. The problem: disconnected data, disconnected decisions

In many organizations the cost estimate that informed approval is not the dataset used by procurement or by the field team. Schedules are developed with different productivity assumptions than those embedded in bids. Change orders are priced using vendor rates that are inconsistent with the original estimate. These fractures have concrete consequences:

  • Loss of traceability. When cost line-items cannot be traced to schedule tasks or to procurement line items, it becomes difficult to reconcile execution outcomes with the original business case.

  • Poor risk management. Inconsistent assumptions obscure the true exposure for contingency, inflation, or local market variation; therefore contingency buffers are either excessive (wasting capital) or insufficient (leading to overruns).

  • Blame and adversarial behaviour. When different teams rely on competing datasets, disputes arise about responsibility for delays and cost increases — increasing conflict and reducing collaboration.

  • Slower decisions and higher cycle-time. Lacking a single objective source of current local costs, procurement negotiations and change approvals require repeated ad-hoc re-pricing and validation.

These problems are not theoretical; they are the predictable outcome of siloed information flows and asynchronous data update cycles.


2. Why objective linkage between cost and schedule matters

Objective linkage — where every schedule task can be associated with a verifiable, locally researched unit cost and procurement line item — delivers a set of practical advantages:

  1. Transparent earned-value and progress measurement. If schedule percent-complete is tied to a costed task list, earned value metrics reflect reality rather than artful assumptions.

  2. Faster, lower-friction change management. Change orders can be priced against the same unit-cost library used at budgeting, reducing negotiation time and dispute incidence.

  3. Accurate forecasting and reforecasting. Real-time or regular updates to unit prices propagate automatically into project forecasts, enabling proactive mitigation.

  4. Aligned incentives and clearer contracts. When everyone relies on the same cost source, contract clauses and incentive structures can be more fairly designed and monitored.

  5. Granular lessons learned and continuous improvement. Objective historical records of unit costs vs. actual performance support benchmarking and future bid accuracy.

These benefits require three things: a reliable local cost dataset, processes that enforce linkage, and cross-functional collaboration to use the data.


3. The role of a robust local cost database

Global or national cost indices and generic adjustment factors and application to “market average” cost databases and historic datasets are helpful but insufficient for execution-level control. Local markets exhibit variation in labor productivity, material availability, and subcontractor behaviours that can change rapidly. A database that is:

  • Objective (data derived from verifiable sources: local bids, vendor quotes, historical project invoices),

  • Granular (task-level, expanded CSI MasterFormat-organised unit tasks), and

  • Frequently updated (quarterly or more often),

enables teams to price and plan from the same factual basis.

For example, Four BT (4BT) provides a local market cost database with tens of thousands of discrete construction tasks, organised to CSI MasterFormat and updated on a quarterly cadence. Using such a dataset as the single source of truth reduces the need for adjustment factors and improves local accuracy — enabling procurement to obtain quotes directly against the same task definitions used by planners and estimators.

Practical impacts include:

  • Straightforward translation of schedule logic to procurement packages;

  • Reduced overhead in validating vendor pricing;

  • Better ability to run “what-if” scenarios during planning using local-price realism.


4. Collaboration: how to operationalise linkage

Data alone won’t fix organisational silos. The following operational patterns are required:

4.1 Joint planning sessions

Planning, procurement and delivery must jointly define the work breakdown structure (WBS) / schedule to be used for bidding, procurement and execution. Standardised task definitions from the cost database should be incorporated into the WBS.

4.2 Shared platforms and single-source datasets

All teams should read and write to the same dataset: schedule tasks carry a unit-cost id that links to the CSI Masterformat-based 4BT library and to procurement line items. Integrations (BIM, CPM, procurement systems) should synchronise those ids to prevent drift.

4.3 Governance and rules of engagement

Decide and document single authorities for pricing updates, approved change-order processes, and an audit trail for any deviations. This prevents ad-hoc overrides and ensures any exception is deliberate and recorded.

4.4 Continuous feedback loops

Field data (actual hours, material consumption) should be fed back into the cost dataset and used to revise productivity assumptions and unit costs — closing the loop between execution and planning.


5. Expected outcomes and metrics

Organisations that successfully link cost and schedule objectively should see improvement in several KPI areas (examples):

  • Reduction in average time to approve change orders.

  • Lower variance between budgeted and final costs (measured percentage).

  • Improved schedule adherence (percent of tasks completed on planned date).

  • Fewer procurement disputes and faster RFQ-to-award cycles.

  • Better forecasting accuracy (variance of reforecast vs. final cost).

link Cost and Schedule data to Projects


6. Barriers and how to overcome them

Barrier: Cultural resistance — teams guarding their datasets.
Fix: Leadership mandate plus small, demonstrable pilot projects showing reduced cycle time or savings.

Barrier: Integration friction — legacy tools lacking APIs.
Fix: Focus on pragmatic integration points (CSV-to-CSV imports, shared ID conventions) and evolve to tighter integrations.

Barrier: Perceived cost of maintaining a local cost database.
Fix: Compare the maintenance cost to the known savings from fewer disputes, lower contingency, and faster procurement cycles — in many cases, the database pays for itself quickly.


7. Conclusion

Objective linkage of cost and schedule data is not an optional nice-to-have; it is a fundamental capability for predictable, transparent project delivery.

The combination of an authoritative local cost dataset (such as 4BT’s task-level database), disciplined processes to enforce linkage, and high-fidelity collaboration between planning, procurement and project delivery teams yields measurable improvements in forecasting, risk management and execution speed. Organisations that adopt this approach convert dispersed information into aligned decisions — and that alignment is where predictable project success begins.

References

Ballard, G. (2000) The Last Planner System of production control. PhD thesis. University of Birmingham.

Koskela, L. (2000) An exploration towards a production theory and its application to construction. VTT Publications.

Project Management Institute (PMI) (2017) A Guide to the Project Management Body of Knowledge (PMBOK Guide), 6th edn. Newtown Square, PA: PMI.

Womack, J.P., Jones, D.T. and Roos, D. (1990) The Machine That Changed the World. New York: Rawson Associates.

Eastman, C., Teicholz, P., Sacks, R. and Liston, K. (2011) BIM Handbook: A Guide to Building Information Modeling for Owners, Managers, Designers, Engineers and Contractors, 2nd edn. Hoboken, NJ: John Wiley & Sons.

Four BT, LLC (2025) 4BT local market cost database — task definitions and update methodology. Internal document.

Broken Construction Estimating Processes

Broken construction estimating processes and associated lack of integration of planning, procurement, and project delivery teams with a robust framework are the reasons 99%+ of projects fail.

Broken Consruction Process – Outdated Estimating Methods That Do NOT WORK.

1. Use of historical construction costs

2. Sole reliance upon contractor and subcontractor bids

3. Use of national average cost data

4. Use of economic or location indexes

5. Parametric, Systems, or Square Foot estimating

What DOES WORK.

1. Detailed line item estimating using granular tasks based upon current means and methods and local market conditions inclusive of labor, material, equipment, and productivity data.

Construction Estimating Processes

Cost visibility and cost management REQUIRES current, standardized, GRANULAR LOCAL MARKET COST DATA and associated detailed line item estimating with a robust process that integrates PLANNING, PROCUREMENT, and PROJECT DELIVERY TEAMS.

Until Owners have sufficient capacity and accountability there will be no measurable improvement addressing the rampant financial and environmental waste endemic to the AECOO sector.

Broken and outdated construction estimating methods persistently undermine cost accuracy, risk management, and project outcomes in the commercial sector. This brief reviews the primary limitations of historical approaches and highlights the detailed, granular line-item estimating that aligns with modern demands for transparency, risk mitigation, and cost control.​

Flaws in Outdated Estimating Methods

1. Use of Historical Construction Costs

Relying on historical data often leads to inaccuracies due to outdated methodologies used in their creations as well as changes in material prices, labor rates, technology, and project requirements. These datasets may be incomplete or not reflect current market realities, making them unreliable for pricing today’s projects.​

2. Sole Reliance upon Contractor and Subcontractor Bids

Focusing solely on competitive bids introduces risk, as bids may be based on incomplete scopes, assumptions, or tactical pricing, undermining scheduling and cost certainty.​

3. Use of National Average Cost Data

National averages ignore local market volatility in materials, labor productivity, and site conditions. Adjustments via generic indexes can yield errors ranging from 30% to over 300%, misrepresenting true local construction costs and leading to substantial budget overruns.​

4. Use of Economic or Location Indexes

Economic or location indexes attempt to localize national data but frequently omit critical distinctions, such as labor productivity, trade skills, and site-specific factors. For example, labor frequently represents 60% or more of total costs, oversimplified indexing creates systemic, unrecognized estimating bias and unpredictable variances.​

5. Parametric, Systems, or Square Foot Estimating

Parametric and square foot approaches fail to reflect project-specific constraints, complexity, and atypical project elements. Reliance on generalized metrics introduces compounded inaccuracy, especially in unique or highly specified builds.​

What Works: Granular Line Item Estimating

The only consistently robust approach today involves detailed line-item estimating using current data for each project-specific task, incorporating local market costs for labor, materials, equipment, and productivity. This method enables transparency, rigorous cost management, and adaptability as market conditions change.​

Key Elements

  • Current and localized cost data: Ensures estimates reflect the most accurate, regionally relevant labor, material, and productivity rates available.​

  • Detailed line items: Each work task is described in plain English with transparent quantities, means, and methods, allowing effective review, validation, and scope clarity.​

  • Integrated planning, procurement, and delivery: Collaborative estimating processes foster better communication among planners, buyers, and builders, aligning expectations and minimizing costly misunderstandings.​

Benefits

  • Substantial reduction in cost overruns and schedule delays attributable to scope gaps or unforeseen market fluctuation.​

  • Greater auditability and accountability, permitting owners and stakeholders to understand, challenge, and improve estimates through clear, standardized cost visibility.​

  • Enhanced ability for benchmarking, procurement leverage, and lifecycle asset management due to systematic baseline data collection.​

Conclusion

Outdated approaches—historical costs, bids without scope granularity, national averages, crude indexing, and parametric/square foot models—no longer meet industry needs for transparency and rigor in cost estimation. Leading practice now demands current, granular, local market cost data and detailed line-item estimates, underpinned by strong integration of planning, procurement, and delivery teams. Only this method enables the precise cost management and risk mitigation necessary for modern construction projects.​

References

Making the Case for Dynamic Cost Estimating

Dynamic cost estimating is critical for delivering verifiable, resilient, and defensible project budgets. Leveraging technologies and data frameworks like those pioneered by 4BT.US, organizations can replace static, historical, and market averaged approaches  (with or without location indexes) with up-to-date, local market intelligence to enhance cost visibility, transparency, and risk management.​

Executive Summary

Dynamic cost estimating enables organizations to adjust to continuously changing market conditions using granular, current, verifiable data. This supports strategic planning, procurement, and project delivery, reducing reliance on outdated averages and enhancing decision-making confidence.​

The Imperative for Dynamic Cost Estimating

  • Traditional estimating methods—using historical data, “market average databases” and location/economic factors, and contractor quotes—limit cost visibility and adaptability in today’s shifting markets.

  • Construction costs are in constant flux due to changes in labor, materials, and equipment.

  • Estimates should represent a range of potential values, allowing for risk-informed decisions rather than relying on static point values.​

  • Dynamic estimating frameworks provide actionable data for ongoing lifecycle management, supporting Lean and Value Management principles.​

Dynamic Cost Estimating

Key Pillars of Dynamic Cost Estimating

  • Use of granular local market data for labor, materials, equipment, and productivity, updated quarterly to reflect real market shifts.​

  • Objective, third-party sourced cost data enables measurable improvement in cost visibility and management.​

  • Detailed organization by standard classification systems such as expanded CSI MasterFormat and UNIFORMAT supports robust programmatic frameworks.​

  • Integration of cost data with collaborative project platforms, enhancing transparency and facilitating data sharing among owners, designers, builders, and oversight teams.​

4BT.US: Dynamic Cost Estimating in Practice

  • 4BT.US offers the only comprehensive, current, local market commercial construction cost data resource, with over 90,000 line items including labor, materials, equipment, and productivity, updated quarterly.​

  • Data is independently researched to reflect local labor and material conditions, minimizing bias and eliminating the flaws of broad economic/location factors and national average data sources.​

  • The software delivers a repeatable and auditable process for estimating, supporting clear documentation and rapid adaptation to market signals.​

  • Preventive maintenance and lifecycle cost elements are also available, benefiting owners with long-term asset management strategies.​

Benefits of Dynamic Estimating

  • Improved cost certainty (30%–40%+ more accurate than traditional methods).​

  • Enhanced risk management through location-based line-item estimating, scenario analysis, and proactive identification of uncertainty.​

  • Reduced project delays and cost overruns by realigning budgets with live, actionable data as market conditions change.

  • Supports integrated, collaborative project delivery by bringing all stakeholders to consensus on cost expectations and changes.​

Conclusion

Dynamic cost estimating is now an operational necessity for organizations seeking robust cost controls, project predictability, and transparency. Platforms like 4BT.US, with their granular, current, and localized approach, set the benchmark for the industry.

References

4BT.US, Construction Estimating Software – Four BT, LLC (2025) Available at: https://4bt.us (Accessed: 10 November 2025).​

4BT.US, Comprehensive Unit Cost Database – Construction – Four BT, LLC (2024) Available at: https://4bt.us (Accessed: 10 November 2025).​

4BT.US, FAST and RELIABLE Cost Estimates – Four BT, LLC (2025) Available at: https://4bt.us (Accessed: 10 November 2025).​

Galorath, D. (2025) Cost Estimation for Projects: Types, Classes, Tools & How … (Accessed: 10 November 2025).​

Project Control Academy (2024) Cost Estimating Best Practices to Enhance Decision-Making. Available at: https://projectcontrolacademy.com (Accessed: 10 November 2025).


← Back

Thank you for your response. ✨

The Role of 4BT in Achieving Both FM Alignment and Buy-In

The Role of 4BT in Achieving Both FM Alignment and Buy-In

4BT (Four BT, LLC) directly addresses this dual challenge through its LEAN Job Order Contracting (JOC) and Integrated Project Delivery (IPD) frameworks, built around objective, current, and locally researched cost data.

1. Enabling Alignment Through Transparency and Shared Data

4BT’s solution ensures alignment by providing a verifiable, shared cost baseline—a single source of truth that all stakeholders can understand and trust, with a robust process framework.   This transparency eliminates one of the greatest barriers to alignment: inconsistent or non-verifiable data.

With this shared visibility, organizations achieve true alignment—everyone understands not just the goals, but the financial and operational realities driving them.

2. Building Buy-In Through Collaboration and Ownership

Beyond alignment, 4BT’s LEAN JOC framework fosters buy-in by engaging all stakeholders early and collaboratively.

  • The process emphasizes joint scope development, transparent pricing, and continuous communication, allowing every participant to see their input reflected in the outcome.

FM Alignment and Buy-In

  • When project participants contribute meaningfully to defining the “what” and “how,” they gain a sense of ownership and investment, transforming compliance into commitment.

This approach converts theoretical support into emotional and operational buy-in—stakeholders not only understand the process but believe in it and actively work toward shared success.

The Role of 4BT in Achieving Both FM Alignment and Buy-In
Achieving Both FM Alignment and Buy-In

3. Sustained Organizational Integration

Through its tools, training, and structured processes, 4BT helps organizations institutionalize both alignment and buy-in as part of their operational culture. The result is a repeatable, scalable model for collaborative, data-driven project delivery—whether for renovation, maintenance, or new construction.


Conclusion

Organizations cannot thrive on alignment alone; nor can they succeed with buy-in in the absence of shared understanding. The integration of both—clarity of direction and commitment to action—is where true performance emerges.

4BT’s LEAN JOC and IPD solutions uniquely deliver this dual foundation. By grounding collaboration in verifiable local cost data and transparent, structured processes, 4BT ensures that teams are not only moving in the same direction but are also motivated to arrive together.

References

Ballard, G. & Howell, G. (2003) Lean project management. Building Research & Information, 31(2), pp.119–133.
Cholakis, P. (2024) Lean Job Order Contracting: Cost Transparency and Collaborative Construction Delivery. Four BT, LLC.
Forbes, L.H. & Ahmed, S.M. (2011) Modern Construction: Lean Project Delivery and Integrated Practices. CRC Press.
Koskela, L. (2000) An Exploration Towards a Production Theory and Its Application to Construction. VTT Technical Research Centre of Finland.
Lichtig, W. (2006) The Integrated Agreement for Lean Project Delivery. Construction Lawyer, 26(3), pp.1–8.
Salem, O., Solomon, J., Genaidy, A. & Minkarah, I. (2006) Lean Construction: From Theory to Implementation. Journal of Management in Engineering, 22(4), pp.168–175.

← Back

Thank you for your response. ✨

Tech Won’t Save FM

Here why Tech Won’t Save FM.
Despite decades of technological advancement, facilities management (FM) fundamentally remains inefficient with respect to the lifecycle management of the built environment. A pervasive reliance on outdated processes and fragmented data systems means that organizations still grapple with a lack of real-time visibility into their portfolios regarding inventory, condition, and operational costs. This systemic deficit is further exacerbated by the absence of objective, granular local market cost data, leading to budgeting inaccuracies and an emphasis on costly, reactive maintenance rather than strategic, predictive upkeep. The prevailing disconnect between leadership and practitioners, coupled with a failure to integrate robust planning, procurement, and project delivery frameworks, ensures that risk management is hampered at every level of operation, from the portfolio down to individual work orders. Ultimately, without standardized, valid data and integrated intelligence, the industry continues to struggle with waste, hidden costs, and suboptimal asset performance. 
Tech Won't Save FM
• Real-time visibility is remains a major barrier.
• Risk structures are still not adequately defined or understood.
• Lack of current, objective, verifiable and actionable data.
• Disconnect between leadership and practitioners.
• Zero accountability

References
  • NEST (2019) Reactive maintenance with integrated facilities management. Available at: https://www.enternest.com/blog/fight-back-against-reactive-maintenance-with-integrated-facilities-management (Accessed: 5 November 2025).
  • Fexa (2025) Data & analytics guide for facilities management. Available at: https://fexa.io/guide/data-analytics-guide-for-facilities-management/ (Accessed: 5 November 2025).
  • ARC Facilities (2024) Data-driven facility management. Available at: https://www.arcfacilities.com/blog/data-driven-facility-management (Accessed: 5 November 2025).
  • City Facilities Management US (2025) Reactive maintenance vs. preventive maintenance explained. Available at: https://www.cityfm.us/blog/reactive-maintenance-vs-preventive-maintenance/ (Accessed: 5 November 2025).
  • Adamtey, R. (2021) ‘Transforming project delivery: integrated project delivery’, in Transforming project delivery: integrated project delivery. Available at: https://www.researchgate.net/publication/363134454_Transforming_project_delivery_integrated_project_delivery (Accessed: 5 November 2025).
  • IFMA (2024) A facility manager’s guide to building a relationship with AI. Available at: https://s3.us-east-2.amazonaws.com/knowledgelibrary.ifma.org/KL_Documents/FNL_AI%20in%20FM%20REPORT.pdf (Accessed: 5 November 2025).
  • Kesari, G. (2025) ‘A maintenance revolution: reducing downtime with AI tools’, MIT Sloan Management Review. Available at: https://sloanreview.mit.edu/ (Accessed: 5 November 2025). 

JOC Risk Management

JOC Risk Management / Job Order Contracting (JOC) Risk Management: The Cornerstone of Program Success


Introduction

Risk management is fundamental to any construction delivery method — but in Job Order Contracting (JOC), it determines whether the program delivers true value or merely faster procurement.

JOC was designed to streamline small- to medium-sized construction, repair, and renovation projects. Yet, many public and private organizations experience limited benefits, often restricted to reduced procurement time. The deeper advantages — cost visibility, cost management, cost savings, and stronger owner–contractor collaboration — remain elusive.

The reason is not inherent to JOC itself, but rather in how it’s implemented, governed, and managed. Effective JOC risk management begins with objective local cost data, disciplined oversight, and a collaborative LEAN culture.


1. Understanding JOC Risks

Every JOC program carries inherent risks that, if unmanaged, can undermine cost transparency and erode trust.
Key categories include:

  • Cost Risk – Use of generic (market average w/wo location factors) or outdated pricing data that doesn’t reflect local market conditions.

  • Scope and Change Risk – Poorly defined work scopes or unclear limits of the JOC framework.

  • Performance and Schedule Risk – Delays in proposal review or job order issuance reduce efficiency.

  • Transparency Risk – Lack of verifiable line-item pricing creates distrust and audit exposure.

  • Relationship Risk – Adversarial, transactional interactions rather than collaborative problem-solving.

  • Administrative Risk – Understaffed or untrained owner teams failing to monitor program compliance.

As noted in multiple government audits, most JOC failures stem from weak program management and inadequate cost data, not from flaws in the contracting model itself (Comptroller NYC, 2022).


2. Why Many JOC Programs Underperform

Despite its promise, JOC often delivers only one consistent benefit — speed. The broader objectives of cost control and collaboration remain unrealized. The reasons are well documented:

  1. Non-local, outdated cost data
    Many agencies rely on national cost books without regional calibration. This produces systemic pricing errors — often ±30–40% from actual local costs — undermining both fairness and accuracy (Washington DES, 2021; NYC Comptroller, 2022).

  2. Weak oversight and performance monitoring
    Audits reveal consistent failures in enforcing contract terms, tracking key metrics, or applying liquidated damages (Comptroller NYC, 2021).

  3. Transactional rather than collaborative culture
    When JOC is viewed purely as a procurement tool, communication and trust deteriorate, negating its potential as a LEAN, integrated delivery framework (CJE, 2016).

  4. Inappropriate scope use
    Deploying JOC for large, complex new builds leads to inefficiencies, cost disputes, and misalignment with its original intent (Washington DES, 2021).

  5. Absence of verifiable cost benchmarks
    Without an objective cost database and transparent adjustment factors, cost visibility claims lose meaning and verifiability (4BT, 2016).


3. The Case for Robust JOC Risk Management

When properly structured, JOC can deliver measurable improvements across cost, time, and quality dimensions.

Effective risk management in JOC means:

  • Using locally researched, granular, and current cost data as the verifiable cost baseline.

  • Establishing formal governance to enforce accountability and performance tracking.

  • Fostering collaboration between owner and contractor through transparency and mutual goals.

  • Monitoring program metrics — cycle time, change order rates, savings, and backlog reduction — to enable continuous improvement.

Studies by the Center for Job Order Contracting Excellence (CJE, 2016) found that robust JOC programs deliver:

  • Up to 24% cost savings versus traditional delivery methods,

  • 91% of projects on budget, and

  • 87% delivered on schedule.


4. JOC Program Risk & Best-Practice Evaluation Checklist

Below is a structured checklist to evaluate whether your JOC program aligns with current best practices.

A. Cost Data Integrity

  • Is the cost catalog, unit price book (UPB) locally researched and updated quarterly?

  • Are line items fully transparent (labor, materials, equipment, O&P)?

  • Are material, labor, and equipment costs locally researched vs. arrived via cost/economic factors?

  • Is data organized in a standard data architecture (e.g. expanded CSI Masterformat)

Risk Indicator: Cost disputes or high variance between estimates and actual costs.
Best Practice: Adopt objective, locally benchmarked cost data (4BT methodology).


B. Governance and Oversight

  • Are program KPIs defined (cost, schedule, backlog reduction, claims)?

  • Are JOC Program audits or peer reviews performed annually?

  • Are liquidated damages and incentives applied consistently?

  • Is the JOC Program managed by Owners vs. a “JOC Consultant”?

Risk Indicator: Audit findings of delayed projects or uncollected penalties.
Best Practice: Formal governance with data-driven oversight.


C. Owner Administration Capacity

    • Does the owner employ trained JOC administrators?

    • Are proposal reviews performed within 10 working days?

    • Is there a centralized data system to track job orders and costs?

    • Are all task orders/projects monitored for JOC Program compliance?
    • Are third-party audits conducted regularly?

Risk Indicator: Project backlog growth or inconsistent pricing reviews.
Best Practice: Dedicated JOC staff and digital tracking tools.


D. Collaboration and Communication

  • Are joint scoping meetings standard practice?

  • Is open-book costing truly implemented?

  • Are contractor performance reviews conducted regularly?

Risk Indicator: Rising change order rates and adversarial interactions.
Best Practice: Regular meetings, shared KPIs, and transparent communication.


E. Continuous Improvement

  • Are completed job order data sets used to recalibrate cost models?

  • Are savings and performance metrics published annually?

  • Does the organization benchmark JOC outcomes against other delivery methods?

Risk Indicator: Static pricing models or declining transparency.
Best Practice: Quarterly data updates and ongoing performance evaluation.


5. Conclusion

A well-managed JOC program is not merely a procurement shortcut — it’s a strategic asset that can deliver verifiable cost control, faster execution, and enhanced collaboration.
However, this transformation depends on one factor above all: risk management built on verifiable local cost data and disciplined governance.

Owners who treat JOC as a collaborative, LEAN delivery framework — supported by objective pricing and transparent performance metrics — will realize its full potential: predictable costs, trust-based relationships, and sustained cost efficiency.

Common risks with “traditional” JOC Programs

  • Hidden cost inflation (due to generic “market average” pricing, location factoring, etc. or unchecked coefficients)

  • Unmonitored backlog growth and weak delivery performance

  • Erosion of trust between owner and contractor

  • Audit findings and reputational damage

  • Lost opportunities for continuous improvement


References (Harvard Style)

FM Systems Thinking

FM Systems Thinking – Critical Success Factors

FM systems thinking is foundational to sustainable life-cycle management of the built environment. FM Systems Thinking 1. Top management leadership, commitment, & support 2.. Early and ongoing team involvement and commitment to promises and mutually beneficial problem solving 3. Common data environment, inclusive of locally researched line-item unit price cost data organized using standard data architecture (CSI-Masterformat) 4. Long-term relationships with locally experienced service providers 5. Motivating people to make change form project mentality to a program mentality

4BT provides a wide range of LEAN integrated project delivery and collaborative Job Order Contracting (JOC) services and support based based upon an FM systems thinking perspective, including but not limited to:

  • Introductory and Advanced Training (on-site, regional, virtual),
  • Informal and Formal Contractor Proposal Compliance Reviews
  • Technical, Professional, and Executive Consulting/Support Services
  • Program Development
  • Workflow Development/Optimization
  • Form Development
  • Program Auditing & Reporting
  • Internal and External (Contractor) Marketing
  • Change Management and Support
  • Capital Planning and Management Strategy
  • Asset Life-cycle Total Cost of Ownership Strategy

FM Systems Thinking

Recognize Symptoms — Study the Problem — Identify the Root Cause — Deploy Solution — Test and Confirm Results

4BT is helping governments and other public sector organizations to better meet their facilities and physical infrastructure objectives via building FM system thinking awareness. Well-governed public sector facilities directly contribute to building greater public trust, enhanced well-being, and better communities.

  • Leverage FM systems thinking
  • Deliver projects on time and on budget
  • Lower administrative burden and costs
  • Increase cost visibility and transparency
  • Build stronger internal and external teams

4BT is helping governments and other public sector organizations understand and deploy FM Systems Thinking to better meet their facilities and physical infrastructure objectives.

Well-governed public sector facilities and real property planning, procurement, and project delivery contribute directly to greater public trust, enhanced well-being, and better communities. Key focus areas include: #1. Identifying and categorizing all real property under management, #2. Prioritizing actions needed to improve the operational and fiscal management of the real property inventory via FM systems thinking methods, #3. Using verifiable, locally researched detailed line-item cost data and life-cycle cost estimations for those actions, and #4. Identifying asset management goals and measuring progress towards those goals.

← Back

Thank you for your response. ✨

Dynamic Construction Cost Data – Construction

Dynamic Construction Cost Data

“Dynamic construction cost data” is locally researched, granular, and updated quarterly to reflect current market conditions, unlike static national averages, historical costs, location factoring, etc..

It is used for detailed estimating and cost management in renovation, repair, and new construction projects (example) 4BT OpenCOST(tm) and Benchmark Constructin Estimator(tm) products.

-Dynamic: The cost information is not static; it’s continuously updated to stay current with market changes.

-Cost Data: A comprehensive database of granular line item construction costs, which includes labor, materials, and equipment.

-Granular: The data is broken down into very specific, detailed line items (over 90,000) that represent individual construction tasks, rather than broad categories.

-Locally Researched: Instead of applying a generic factor to a national average, relying upon contractor bids, or using historical costs, 4BT surveys actual local markets to gather data, which results in more accurate pricing for specific projects.

-Updated Quarterly: The data is refreshed every three months to ensure it reflects the most current market conditions.

Dynamic Construction Cost Data

Key features and benefits

Improved accuracy: Locally researched data provides a more accurate cost basis than national averages adjusted by a location factor.

Detailed breakdown: The granular, line-item data allows for more detailed and verifiable cost estimating.

Dynamic construction cost data

Standardization: The data is organized using expanded CSI MasterFormat, which provides a consistent and uniform language for all project stakeholders.

Supports various projects: It can be used for new construction, renovation, repair, and maintenance projects.

Supports specific contracting models: It is widely used for Job Order Contracting (JOC) and other LEAN construction methodologies.

Unit Price Book – Actionable Construction Cost Data

#costdata #construction #dynamic #local #locallyresearch #costsavings #productivity #IPD #integratedprojectdelivery #jobordercontracting #joc

← Back

Thank you for your response. ✨


4BT OpenCOST(tm) is recognized as the only source of locally researched, current, and granular construction cost data that is organized using expanded MasterFormat and updated quarterly—without relying on economic or location factoring. This approach delivers unique transparency and accuracy compared to nationally averaged cost databases.

4BT OpenCOST Key Features
-Locally Researched Costs: 4BT actively surveys local markets for labor, materials, and equipment, rather than applying broad location multipliers to national averages.
-Granular Data Structure: The database contains over 90,000 detailed unit price line items, covering most typical tasks in renovation, repair, maintenance, and new construction.
-Expanded MasterFormat Organization: Line items are structured using CSI MasterFormat divisions and sections for clarity and consistency across all estimates.
-Quarterly Updates: Data is refreshed quarterly (with major annual revisions), ensuring cost information reflects recent market shifts and localized fluctuations.
-No Economic or Location Factoring: Costs are not estimated using multipliers or indexes but are instead directly based on in-region market research, avoiding errors often introduced by averaging and adjustments.
-Objective and Independent: The methodology is transparent, and the data is defensible for audits, benchmarking, and procurement under best-value frameworks.

Industry Context
Competing databases (RSMeans/Gordian, BNI, etc.) often rely on national averages adjusted by location factors, which can result in significant estimating errors for local projects and lack the transparency required for best-value construction delivery.

4BT’s data is preferred for projects demanding audit-ready, line-item cost control and transparency, especially under Job Order Contracting (JOC), LEAN, and Integrated Project Delivery (IPD), and validation of contractor and subcontractor quotes.

For owners, contractors, and estimators who require precise, verifiable, and locally specific construction cost data organized using industry standards, 4BT OpenCOST stands alone in its methodology and update practices.


Leveraging current, actionable data is key for sustainable Facility Management including repair, renovation, maintenance, and new construction
For example, utilizing dynamic PM cost and task data, organizations can optimize building operations, maintenance, and planning.

This approach not only lowers costs but also extends the lifespan of buildings and equipment while supporting the organizational mission.

Note: All tradesmarks and rights remain with their respective owners and no endorsements of any kind are given or implied.

5 Helpful Ways the Integrated Project Delivery Framework Cuts Costs – JOC, IPD…

An Integrated Project Delivery Framework is capable of reducing repair, renovation, maintenance, and new build waste 30%-40%.

Implementing an Integrated Project Delivery Framework enhances project efficiency and cost-effectiveness.

Integrated Project Delivery Framework

An Integrated Project Delivery (IPD) Framework like 4BT’s delivers 30%-40% waste reduction in repair, renovation, maintenance, and new construction projects by institutionalizing early collaboration, shared risk and reward, and actionable data-driven decision-making at every phase.

This Integrated Project Delivery Framework promotes collaboration and drives successful project outcomes.

Below is a white paper draft incorporating the core 4BT fundamentals and illustrating how such a framework transforms project outcomes.​

Executive Summary

The 4BT Integrated Project Delivery Framework is a proven holistic method designed to revolutionize project outcomes in facilities repair, renovation, maintenance, and new construction. By embedding a culture of collaboration, transparency, and accountable information exchange from project inception to completion, this framework consistently reduces waste by 30%-40%.

Utilizing the Integrated Project Delivery Framework allows teams to achieve significant cost savings.

Introduction

Traditional construction delivery models often produce siloed decision-making, misaligned incentives, and substantial waste in time, cost, and resources. In the 4BT framework, when combined with existing best management practices, rethinks these defaults with a multi-party contract structure and a methodology centered around mutual respect, early and ongoing collaboration, and continuous process improvement.​

The Integrated Project Delivery Framework mitigates risks through shared decision-making.

Integrated Project Delivery Framework

Core 4BT Fundamentals

  • Early Stakeholder Involvement: All project participants, including owners, designers, contractors, and key trades, are engaged at project inception. This early alignment empowers teams to collaboratively define objectives, scope, and critical success factors from the outset, reducing late-stage surprises and costly changes.​

  • Shared Risk and Reward: Multi-party contracts formalize shared financial incentives so that value creation and cost control benefit all participants. Savings are distributed among stakeholders if projects are delivered under budget; losses are also collectively managed.​

    Through the Integrated Project Delivery Framework, stakeholders can realize enhanced communication and efficiency.

  • Collaboration and Transparency: Systems thinking-based processes prioritize transparent communication and comprehensive information sharing, using tools like open standards, shared digital platforms, and actionable cost and technical data. This ensures that all participants have full technical and cost visibility to make timely, informed decisions.​

  • Actionable Data and Metrics: 4BT’s framework leverages locally researched cost data, continuous monitoring of key performance indicators (KPIs), and robust cost management tools that support confident early decision-making and adaptive planning.​

    An effective Integrated Project Delivery Framework incorporates robust data analysis for better outcomes.

  • Continuous Education and Process Improvement: Ongoing training, education, and organization-wide culture shifts underpin the reduction in waste, ensuring that all staff understand lean principles and can implement them consistently across each project.​

Key Results: Waste Reduction

The framework delivers quantifiable improvements:

  • Consistently 30%-40% reduction in waste on repair, renovation, maintenance, and new build projects by eliminating duplicative processes, change orders, and miscommunication.​

  • Over 90% of projects delivered on time and on budget with reduced disputes and change orders, supported by transparent audit-ready cost data.​

  • Full client-centric service orientation with increased satisfaction and value realization due to integrated stakeholder engagement.​

    Clients benefit from the value-driven approach of the Integrated Project Delivery Framework.

Implementation Steps

  • Adopt multi-party relationship-based contracts with clear governance and execution guidelines.

  • Initiate early project definition sessions involving all key participants.

  • Deploy 4BT’s cloud-based cost data and project management tools for real-time visibility.

  • Establish performance-based incentives and KPIs to encourage ongoing alignment.

  • Invest in robust training and continuously refine processes using data-driven feedback.

Integrated Project Management 2025 4BT scaled

Conclusion

The 4BT Integrated Project Delivery Framework is a transformative, evidence-based solution for organizations seeking to reduce costs, maximize efficiency, and improve outcomes across the entire facilities lifecycle. Through collaborative planning, open data, and a culture of mutual trust, the 4BT model establishes a new benchmark in construction project delivery that can be scaled and adapted to diverse project needs.​

The 4BT Integrated Project Delivery Framework exemplifies a modern solution for optimizing project delivery.

Integrated Project Delivery Framework PPIT People Process Information Technology Framework 2025

← Back

Thank you for your response. ✨

Addendum:

4BT Benchmark Construction EstimatorTM    –  Cost Estimating Software with DYNAMIC LOCAL MARKET DATA

Validate Construction Costs!

4BT Benchmark Construction Cost Estimator – is the only source of current, local market, granular cost data for repair, renovation, maintenance (preventive maintenance), and new construction complete with labor, material, equipment and productivity information, organized via expanded CSI MasterFormat and/or expanded UNIFORMAT based upon application, with over 90,000 line items, updated quarterly.

A consistent, repeatable, reproducible, cost estimating and management process.

This information is critical to developing cost visibility and management capability for owners, design-builders, and oversight groups and for creating and supporting efficient, collaborative, and integrated planning, procurement, and project delivery teams.

WHITE PAPER Create Reliable, Defensible Construction Cost Estimates Faster

Understanding Independent Government Cost Estimates

Understanding Independent Government Cost Estimates

A public sector organization benefits greatly by appropriately preparing an independent government estimate (IGE) for facilities repair, renovation, maintenance, and new build projects.  Their primary value lies in helping public sector organizations validate contractor proposals with respect to  reasonableness and realism.

Independent Government Estimate

The process involves an owner or owner’s representative using a detailed scope of work about any repair, renovation, maintenance, or new build activity to develop a line-item construction cost estimate independent of contractor overhead and profit.

Independent Government Estimate

A reliable, defensible, and efficient method to build an IGE is to use a objective, current, locally researched unit price book (UPB).  The UPB data should also use common terms and definitions and standardized data architecture (e.g. expanded CSI Masterformat.

The use of current locally researched information in lieu of “national average” cost data and location or economic factoring increases precision, as location or economic factoring has been demonstrated to introduce significant error.

Note: Contractors can follow the same type of process to validate subcontractor costs.

Factors impacting estimation: Construction, Repair, Renovation, New Build

Factors impacting estimation:

• Experience and skill level of the estimator.

• Estimating technique employed.

• Quality of reference cost estimating data.

• Quality of assumptions used in preparing the estimate.

• Time and level of effort budgeted to prepare the estimate.

• Complexity of the project

• Social, environmental, and regulatory circumstances.

• Level of technology competency.

Construction Cost Data Comparison – A White Paper

4BT Local Market Construction Cost Data


Job Order Contracting Strategy

Developing and managing an efficient Job Order Contracting Strategy requires asking the right questions.

Effective Job Order Contracting Strategy for Professionals – Learn how to develop a successful Job Order Contracting Strategy by addressing key questions and resource needs.

Job Order Contracting Strategy

Job Order Contracting Strategy Questions

  1. What are the quantitative and qualitative goals of the JOC Program?
  2. How does the JOC Program support your organization’s critical objectives?
  3. Do I have the required resources to develop, deploy, and manage a JOC Program?
  4. Do I understand the benefits of owner-managed versus “JOC consultant-managed” JOCs?
  5. Is my unit price book/UPB/construction task catalog dynamic, granular, locally researched, and organized using expanded CSI Masterformat?
  6. Do I have the support of senior leadership?

Four BT, LLC – CAPABILITY STATEMENT

Established in 2016, Four BT, LLC. (“4BT”) is a certified veteran-owned small business (VOSB) focused upon providing objective, verifiable, and current local market construction cost data, as well as secure cloud-based technology for construction cost estimating and full related support services to enable efficient planning, procurement, and project delivery.  Our solutions support collaborative Job Order Contracting, Integrated Project Delivery, and similar frameworks.

4BT provides its solutions to  Federal-DoD, State, County, and Local Governments as well as a range of educational, healthcare, and transportation, organizations, national cooperatives,  and their design-build service providers.

Four BT, LLC (4BT) is known for its excellence in local market construction cost data, full solution sets, and client support.

Evidence-Based Estimating – Construction

Evidence-based estimating requires current, local market labor, material, and equipment costs for associated repair, renovation, maintenance activities associated with relevant means and methods.

While the traditional estimating remains largely dependent upon subcontractor proposal, historical data, and national average cost data with location and economic factors, none of these provide the verifiable cost data needed to enable cost visibility and reliable cost management.

Evidence-based estimating

Learn more about 4BT Local Market Cost Data and Evidence-base Estimating …

  1. Comprehensive
  2. Industry Format
  3. Verifiable
  4. Current
  5.  Granular
  6. Actionable

Construction cost estimating is critical for accurate budgeting, planning, and project execution. Many still rely on RSMeans national average cost data adjusted with location factors (e.g., City Cost Index, DoD Area Cost Factors), subcontractors, and/or historical data. While convenient, these methods often fail to reflect true local market conditions and can introduce significant risk to project costs.

Key Issues with Location Factors

  • Not Intended for Detailed Estimates: Location factors were designed for conceptual or early-phase estimates, not for appropriation-quality budgets.
  • High Error Potential: Studies report errors ranging from -100% to +200% when using location factor adjustments in early project phases.
  • Inability to Capture Local Conditions: Location factors cannot account for labor, material, or equipment variability , often resulting in cost swings.
  • Static Methodology: Not reflective of local market dynamics.
  • Budget Risk: Reliance on location factors can lead to inaccurate budgets, increased change orders, and funding shortfalls.
  • Contractor Disputes: Over- or under-estimated costs increase the likelihood of claims and project delays.
  • Limited Transparency: Stakeholders lack verifiable cost visibility, making cost management less effective.

Transitioning to current, verifiable, locally researched cost data provides the DoD with reliable budgets, stronger cost control, and better alignment with modern, collaborative construction delivery practices.

Evidence-based estimating

References

  • Gordian/RSMeans. (2025). RSMeans Location Factor Disclaimers and Methodology Notes.
  • Peitlock, B.A. (1998). Developing Location Factors Using a Factoring Method. ICEC International Cost Management Journal.
  • Migliaccio, G. (2013). Empirical Assessment of Spatial Prediction Methods for Location Cost Adjustment Factors. Journal of Construction Engineering and Management.
  • University of Colorado Denver, Dept. of Civil Engineering. (2017). Validation of Project-level Construction Cost Index Estimation Methodology.

Note:  All trademarks and rights remain solely with their respective owners and no endorsements are given or implied.

Boosting Collaborative Project Delivery for Better Results

Procurement and planning teams face increasing pressure to deliver projects faster, within budget, and with measurable value. Traditional methods often create silos—where owners, contractors, and stakeholders struggle to align for effective Collaborative Project Delivery.

Embracing Collaborative Project Delivery for Enhanced Teamwork

The result? Cost overruns, delays, and wasted resources. This environment necessitates a shift in mindset, where collaboration becomes central to the project delivery process. For instance, teams can implement regular check-ins to assess progress and adjust strategies proactively. By breaking down barriers and ensuring open lines of communication, teams can respond to challenges more effectively, ultimately enhancing project outcomes through Collaborative Project Delivery.

A collaborative project delivery approach changes the game. Emphasizing the importance of Collaborative Project Delivery ensures all parties are aligned and working towards common goals.

By fostering early and transparent communication, teams establish shared goals, clear accountability, and a unified understanding of scope and budget. This creates a foundation for: Furthermore, incorporating technology such as project management software can facilitate this collaboration, allowing real-time updates and shared documentation. The use of collaborative tools ensures that everyone is on the same page, reducing the likelihood of miscommunication and fostering a team-oriented environment.

Collaborative Project Delivery
Collaborative Project Delivery Solution Framework

🔹 Enhanced Cost Visibility – When all stakeholders leverage objective, locally researched cost data, estimates become more reliable, and financial risks decrease. By utilizing advanced cost estimation techniques, teams can better project expenses and allocate resources efficiently.

🔹 Fewer Delays & Disputes – Shared decision-making and structured workflows reduce bottlenecks and finger-pointing. For example, employing conflict resolution strategies can preemptively address disagreements.

🔹 Waste Reduction – Lean practices help eliminate rework, inefficiencies, and misalignment between planning and execution. Implementing a continuous improvement philosophy allows teams to identify and rectify wasteful practices regularly.

🔹 Better Outcomes – Collaboration isn’t just about finishing faster; it’s about improving quality, transparency, and long-term value. Engaging stakeholders throughout the process ensures that their needs are met, which contributes to the overall success of the project.

For procurement and planning teams, the shift toward integrated, collaborative delivery means better predictability and stronger results. The key is adopting frameworks—like Job Order Contracting (JOC) and Integrated Project Delivery (IPD)—that are built on trust, verifiable data, and shared accountability. Additionally, training sessions on collaborative techniques can empower teams to work more effectively together, fostering an environment where innovative solutions can thrive. These frameworks not only promote efficiency but also encourage a culture of continuous learning and improvement, essential for adapting to the ever-evolving project landscape.

When collaboration drives delivery, everyone wins: owners, contractors, and end users alike. For instance, clients often report higher satisfaction levels when they feel included in the decision-making process. Similarly, contractors benefit from clearer project expectations and reduced rework, paving the way for stronger relationships and repeat business. This win-win scenario enhances the industry’s reputation and encourages more organizations to adopt collaborative practices.

👉 Ready to explore how collaborative project delivery can improve results for your organization? Let’s connect and start the conversation. By discussing your unique challenges and objectives, we can tailor a collaborative approach that aligns with your goals, ensuring that every project is delivered successfully and meets or exceeds expectations.

← Back

Thank you for your response. ✨

#LeanConstruction #ProjectDelivery #Collaboration #Procurement #CostManagement #CollaborativeProjectDelivery

Cost Data Vendor Selection

Construction cost data vendor selection is an important aspect to enabling facilities and other built structure repair, renovation, maintenance, and new build activities to be delivered on time, on budget, and per client requirements.

Here’s a structured framework you can use for Cost Data Vendor Selection Criteria in construction, facilities management, or related fields. It covers both technical quality and business fit:


1. Data Quality & Reliability

  • Locality & Granularity – Availability of objective, locally researched unit price data vs. reliance on national averages and factorsThe Critical Importance of Objective, Current, and Granular Local Market Construction Cost Data in Estimating Software WHITE PAPER

  • Frequency of Updates – How often cost data is refreshed (quarterly, annually, ad hoc).

  • Depth of Database – Number and type of detailed, line item construction tasks covered.

  • Data Verification – Transparent sourcing and methodology for how costs are researched and validated.

  • Historical Data & Trends – Availability of time-series data and ability to update costs/estimates.


2. Transparency & Auditability

  • Open Methodology – Clear documentation of how unit prices are built (labor, material, equipment, productivity).

  • Audit Trail – Ability to trace back pricing to primary sources and local market surveys.

  • Cost Visibility – Line-item transparency vs. aggregated factors or black-box pricing.


3. Technology Integration

  • Format & Compatibility – Alignment with expanded CSI MasterFormat, Uniformat, or owner-preferred standards based upon use requirements.

Cost Data Vendor Selection

  • API / System Integration – Ability to integrate with estimating, BIM, ERP, CMMS, or procurement systems.

  • Ease of Use – Searchability, customization, and data access.


4. Coverage & Applicability

  • Project Types – Breadth across new construction, renovation, maintenance (including preventive maintenance task, checklists and local costs), and specialty trades.

  • Geographic Reach – Coverage across U.S. regions or globally, with emphasis on local market conditions.

  • Sector Fit – Relevance to federal, state, institutional, or commercial project requirements.


5. Support for LEAN / Collaborative Delivery

  • Transparency in Pricing – Supports integration with IPD, collaborative JOC, and Progressive Design-Build and other LEAN frameworks.

  • Benchmarking & Validation – Enables owners and builders to validate estimates against local market data.

  • Flexibility – Customizable to reflect unique owner standards, productivity assumptions, or local practices.

Cost Data Vendor Selection


6. Vendor Credentials & Stability

  • Experience & Reputation – Track record with government, institutional, and private sector clients.

  • Financial Stability – Vendor viability for long-term support.

  • Independence & Objectivity – Avoidance of conflicts of interest (e.g., vendors aligned with specific procurement software and/or vendors directly involved in project approvals).

  • References & Case Studies – Demonstrated success with comparable organizations.


7. Service & Support

  • Training & Onboarding – Availability of user training and implementation support.

  • Customer Support – Responsiveness and expertise of experienced help desk or consulting staff.

  • Customization Services – Ability to develop owner-specific databases or cost models.


8. Cost & Value

  • Licensing Model – Subscription, perpetual license, enterprise agreements. (Note:  No excessive fees based upon construction volume.)

References:

#1. – “Location factors are used during preliminary project evaluations. They are not intended to be used when preparing appropriation-quality estimates. They often are applied to conceptual estimates for identifying “go/no-go” projects at an early stage.” (Peitlock, B.A., ccc, Developing Location Factors Using a Factoring Method, International Cost Engineering Council, ICEC International Cost   Management Journal (ICMJ), 1998.)

#2. Location factors are primarily used in class 4 and 5 estimates and are not intended to be used for higher quality estimates, such as class 3, 2, or 1. The RSMeans city cost index (CCI) and the Department of Defense area cost factor (ACF) index are two primary examples of location factor publications. (Martinez, A., Validation of methods for adjusting construction cost estimates by project location , University of New Mexico UNM   Digital Repository, 2010)

#3. “Despite its potential weaknesses, estimation by adjustment factors is a very common approach for all types of construction. A very common approach for performing quick-order-of-magnitude estimates is based on using Location Cost Adjustment Factors (LCAFs). The accuracy of cost estimates in the early phases varies within an expected range that spans from -100% to +200% ” “Using the results of this study, various commercial entities (e.g., RS Means) could enhance their online tools by uploading publicly available socio-economic variables and allowing users to perform geostatistical analysis. As a result, a cost engineer could input the location of a project and obtain the most accurate location adjustment factor through a mix of interpolation and geostatistical prediction techniques.” (Migliaccio, G., Empirical Assessment of Spatial Prediction Methods for Location Cost Adjustment Factors, J Constr Eng Manag. 2013)

#4. “Problems within the methodology, unfortunately, will continue to arise as standardized estimation tools (CCI) simply cannot account for the unique characteristics of individual states.  Unfortunately, the accuracy of program-wide CCIs occasionally led to swings of ±20 percent after projects had gone through the bidding process. Additionally, no direct application of market or economic conditions existed in this conventional CCI process, which was theorized by FHWA to potentially be a significant influence on resulting project estimate accuracy. ”    (University of Colorado Denver College of Engineering and Applied Science Department of Civil Engineering, Validation of Project-level   Construction Cost Index Estimation Methodology, 2017)


Note: All trademarks and rights remain with their respective owners and no endorsements of any kind are given or implied.

Understanding Construction Cost Data: A Comprehensive Guide for Business Owners and Facilities Managers

Understanding Construction Cost Data is central to improving built environment planning, procurement, and project delivery.

Request the WHITE PAPER – Understanding Construction Cost Data: A Comprehensive Guide for Business Owners and Facilities Managers

Executive Summary

Construction cost data is a foundation for well-informed decisions, budget optimization, and project success. Crucially, only timely, objective, and locally researched cost data provides the precision needed for appropriation-quality estimates and defensible budgeting. Four BT, LLC is the only provider of independently researched, locally sourced construction cost data—setting the standard for reliability and transparency in North America. Multiple academic and industry citations confirm the necessity of locally researched data and the limitations of national average indexes and location adjustment factors.

  • “Location factors are used during preliminary project evaluations. They are not intended to be used when preparing appropriation-quality estimates.” (Peitlock, ICCMJ, 1998)
  • “Location factors … are not intended to be used for higher quality estimates.” (Martinez, UNM, 2010)
  • The accuracy of adjustment factor estimates in early phases can vary from –100% to +200%. Geostatistical prediction techniques may improve accuracy if locally based. (Migliaccio, J Constr Eng Manag, 2013)
  • Standardized cost indexes (CCI) cannot account for unique conditions by state and may lead to ±20% swings after bidding; local economic conditions are especially influential. (Univ. Colorado Denver, 2017)

Understanding construction cost data

← Back

Thank you for your response. ✨

understanding construction cost data


FM Competencies

Here’s a perspective on an expanded set of FM competencies that go beyond traditional building maintenance to a more strategic, people-focused, and collaborative approach.
Strong, accountable leadership and process improvement are foundational to achieving “best value outcomes”.    The focus upon relationships and the adoption of collaborative, integrated practices and a focus on long-term asset life-cycle management require multiple competencies.
  • Best management practices: Owners and operators should focus on implementing better processes and accountability rather than just new technology.
  • Leadership and strategy: FM is a leadership function. Competent leadership is required to steer the industry toward sustainable asset life-cycle strategies and practices that are aligned with organizational goals.
  • Collaboration and relationships: A people-first strategy involves collaborative relationships among all participants and stakeholders—owners, architects, engineers, and service/materials providers.
  • Data and cost visibility: Facility owners often lack the capability to provide cost visibility and transparency. Competent facility managers need to have a strong understanding of life-cycle costs and use reliable data, including locally researched cost data, for estimating and decision support.
  • Lean and integrated processes: Lean, collaborative practices and integrated project delivery methods to maximize the capabilities of people, processes, information, and technology. This is essential for achieving efficient life-cycle management of facilities.
  • Beyond fixing things: The modern FM professional must be adept at using technology, and gathering, leveraging and maintaining current actionable data to support informed decision-making. 
Foundational competencies
  • Communication: FMs must effectively communicate with all stakeholders, from occupants to executives.
  • Leadership and strategy: Aligning facility strategy with the organization’s mission and guiding staff and providers.
  • Technology integration: Using technology to streamline operations and manage assets.
  • People-centric focus: A core purpose of FM is providing a productive and safe environment for people, not just maintaining buildings. 
Knowledge-based competencies
  • Asset management: Strategic planning, capital planning, and project management for a building’s assets.
  • Operations and maintenance (O&M): Managing daily maintenance, occupant services, and utilities.
  • Risk management: Developing strategies for emergency preparedness, safety, and security.
  • Business management: Handling human capital, finance, procurement, and contract management. 
Cross-functional competencies
  • Managerial: Planning, organizing, and directing work.
  • Cognitive: Identifying patterns and making logical connections based on data.
  • Interpersonal: Using emotional intelligence to perform professionally. 


bimf building information management framework

← Back

Thank you for your response. ✨

Independent Government Cost Estimate

A public sector organization benefits greatly by appropriately preparing an independent government cost estimate (IGE).  The primary value lies in helping public sector organizations validate contractor proposals with respect to  reasonableness and realism.

The process involves an owner or owner’s representative using a detailed scope of work about any repair, renovation, maintenance, or new build activity to develop a line-item construction cost estimate independent of contractor overhead and profit.

A reliable, defensible, and efficient method to build an IGE is to use a objective, current, locally researched unit price book (UPB).  The UPB data should also use common terms and definitions and standardized data architecture (e.g. expanded CSI Masterformat),  The use of current locally researched information in lieu of “national average” cost data and location or economic factoring increases precision, as location or economic factoring has been demonstrated to introduce significant error.

independent government estimate
Sample Independent Government Estimate


Note: Contractors can follow the same type of process to validate subcontractor costs.


Learn more… or download White Paper – Reliable Cost Estimates

← Back

Thank you for your response. ✨

4BT Local Market Construction Cost Data

Construction SHOULD COST

How does one determine construction should cost?

Verifiable and detailed local market cost data is a core component of what a project “should cost” without builder overhead and profit.

Owner and design-builders can achieve better project outcomes and reduce costs using a robust, comprehensive procurement method to determine the fair and reasonable price of any repair, renovation, maintenance, or new build activity based on a detailed analysis of its detailed line-item components.

Methodology: Examining individual cost drivers, including current, local market labor, material, and equipment information enables an reliable cost estimate from the ground up.

This fact-based approach challenges inflated prices and identifies opportunities for improvement.

Owners and builders can use this insight to negotiate better terms and collaboratively to improve efficiency and reduce costs and improve overall satisfaction.

4bt.us

Trusted Construction Cost Data

Trusted construction cost data is critical to developing cost visibility and management capability for owners, design-builders, and oversight groups and for creating and supporting efficient, collaborative, and integrated planning, procurement, and project delivery teams.


trusted construction cost data

← Back

Thank you for your response. ✨


#construction #cost #data #local #current #verifiable

Reserve Studies vs. Facilties Condition Assessments

Reserve Studies vs. Facilties Condition Assessments
A reserve study is a long-term financial plan for an HOA that includes a financial analysis and a physical analysis of common assets, whereas a condition assessment focuses on the current physical health and immediate maintenance needs of a property’s components, usually within a shorter timeframe of 5-10 years

A reserve study uses a full or partial condition assessment as a component of its physical analysis but then creates a funding plan to ensure future repair and replacement costs are met.  

Reserve Study
  • Purpose: To create a long-term financial plan for maintaining, repairing, and replacing common area assets by projecting future expenses and setting up a funding strategy. 
  • Scope: Analyzes all association-maintained components like roofs, siding, pools, and roads to estimate their remaining lifespan and replacement costs. 
  • Time Horizon: Typically covers 5 to 10 years
  • Key Outputs: A funding plan to cover future costs, preventing special assessments and promoting financial stability. 
  • Involves: A physical analysis (which includes a full or partial condition assessment) and a financial analysis of the reserve fund. 
Condition Assessment 
  • Purpose: To evaluate the current state of equipment or infrastructure, identifying signs of wear, deterioration, or damage to determine immediate maintenance needs. 
  • Scope: Involves thorough, often non-invasive, visual inspections and testing of individual components to understand their present condition. 
  • Time Horizon: Generally looks at the next 5 to 10 years for maintenance and repair priorities. 
  • Key Outputs: A detailed report on the property’s physical health and a prioritization of necessary repairs. 
  • Role in Reserve Study: A condition assessment is a crucial part of a reserve study’s physical analysis, providing the essential data on the current state of assets that then informs the financial planning. 
Role of Locally Researched Cost Data vs. National Average Cost Data
For financial analyses like a reserve study, it is far more accurate and reliable to use current, locally researched, granular cost data rather than national market averages adjusted by location factors. While national averages can offer a rough preliminary estimate, they are insufficient for creating accurate, long-term budgets. 
Why locally sourced cost data is important
  • Significant regional variations: National averages smooth over major cost differences driven by local factors like labor rates, material supply chains, regulatory fees, and market volatility. This can cause discrepancies of 30% or more when compared to actual local costs.
  • Highly local labor market: Labor costs are hyper-local and fluctuate based on the availability of skilled workers, unionization, and competition. A national average fails to capture these market nuances.
  • Material cost fluctuations: Raw material prices can change rapidly due to local supply chain dynamics, not just national or global trends. Relying on outdated or averaged material costs can lead to major budget shortfalls.
  • Project-specific variables: Granular, local data can account for unique site conditions, specific building complexities, and regional regulatory requirements that a broad national average cannot.
  • Improved financial transparency: For a homeowners association (HOA), documented pricing based on actual, local historical data from contractors provides the most transparent and verifiable cost information. This builds trust with stakeholders and provides confidence in the budget’s accuracy.
  • Avoids project risk: Estimates based on flawed or generic data frequently lead to underestimated costs, which can result in budget overruns, project delays, or even cancellations. 
Reserve Studies vs. Facilties Condition Assessments
Limitations of using national averages and location factors
  • Intended for preliminary estimates only: Location factors and broad cost indexes (such as those from RSMeans) are designed for conceptual estimates in the early planning stages, not for detailed, “appropriation-quality” budgeting.
  • Inaccurate adjustments: Adjustment factors and city-wide multipliers are not precise enough to reflect the full complexity of a local market. They may not account for local codes, differences in productivity rates, or unique climatic conditions.
  • Outdated information: Cost databases are often updated annually. This means they can fail to reflect the economic shifts and market volatility that can occur over shorter periods, especially in areas with high inflation. 
How to get the most accurate cost data
For reserve studies and condition assessments, the best practice is to use documented pricing based on current, local market conditions. This includes: 
Note:  A trademarks and rights remain with their respective owners and not endorsements of any kind are implied or given.

Reliable defensible estimates – faster.

Finally, there is a way to create reliable, defensible estimates – faster.

Line-item detailed estimates are the most reliable and now you can easily create them with confidence using current, objective, verifiable, local market cost data, complete with labor, material, equipment, and productivity details.

While “market average” cost data has traditionally been the only choice, you know the issues, and now a superior alternative, granular, current detailed lined item cost data (90,000+ line items) available exclusively from 4BT (Four BT, LLC).

Finally, there is a way to create reliable, defensible estimates – faster, using current, verifiable local market cost data.

Learn more?  https://4bt.us/unit-price-book/

← Back

Thank you for your response. ✨


Note:  Issues with market average construction cost data.

#1. – “Location factors are used during preliminary project evaluations. They are not intended to be used when preparing appropriation-quality estimates. They often are applied to conceptual estimates for identifying “go/no-go” projects at an early stage.” (Peitlock, B.A., ccc, Developing Location Factors Using a Factoring Method, International Cost Engineering Council, ICEC International Cost   Management Journal (ICMJ), 1998.)

#2. Location factors are primarily used in class 4 and 5 estimates and are not intended to be used for higher quality estimates, such as class 3, 2, or 1. The RSMeans city cost index (CCI) and the Department of Defense area cost factor (ACF) index are two primary examples of location factor publications. (Martinez, A., Validation of methods for adjusting construction cost estimates by project location , University of New Mexico UNM   Digital Repository, 2010)

#3. “Despite its potential weaknesses, estimation by adjustment factors is a very common approach for all types of construction. A very common approach for performing quick-order-of-magnitude estimates is based on using Location Cost Adjustment Factors (LCAFs). The accuracy of cost estimates in the early phases varies within an expected range that spans from -100% to +200% ” “Using the results of this study, various commercial entities (e.g., RS Means) could enhance their online tools by uploading publicly available socio-economic variables and allowing users to perform geostatistical analysis. As a result, a cost engineer could input the location of a project and obtain the most accurate location adjustment factor through a mix of interpolation and geostatistical prediction techniques.” (Migliaccio, G., Empirical Assessment of Spatial Prediction Methods for Location Cost Adjustment Factors, J Constr Eng Manag. 2013)

#4. “Problems within the methodology, unfortunately, will continue to arise as standardized estimation tools (CCI) simply cannot account for the unique characteristics of individual states.  Unfortunately, the accuracy of program-wide CCIs occasionally led to swings of ±20 percent after projects had gone through the bidding process. Additionally, no direct application of market or economic conditions existed in this conventional CCI process, which was theorized by FHWA to potentially be a significant influence on resulting project estimate accuracy. ”    (University of Colorado Denver College of Engineering and Applied Science Department of Civil Engineering, Validation of Project-level   Construction Cost Index Estimation Methodology, 2017)

Predictive Construction Cost Data

Predictive construction cost data is of questionable value at best.   
What is predictive construction cost data?
Predictive construction cost data involves using machine learning (ML) / AI and data analysis/mining to forecast project costs by incorporating historical data, market conditions, resource needs, and risk assessments.  The goal, to identify patterns and predict costs with increasing accuracy throughout a project’s lifecycle, is based upon a flaw assumption, that past performance is an indicator of future outcomes.
Tools claiming to achieve predictivie cost modeling should be carefully scrutinized


Monitoring current material, labor, and equipment costs, supply chain issues, and economic shifts is crucial for construction cost estimating and the development of objective, verifable, construction cost databased.  The process is critical to improving planning, procurement, and project delivery phases and associated outcomes.  That said, the adoption of this process, while certainly a best management practice, is separate from the concept of “predictive construction cost data”.


  • Resource Allocation:Planning for labor, materials, and equipment needs and estimating associated costs are essential components of cost forecasting.
  • Risk Assessment:Identifying potential risks and uncertainties within a project allows for the estimation of their financial impact.
Tools
  • Locally Researched Construction Cost Data:  Resources like 4BT’s construction cost data provide extensive construction cost databases to support objective and verifiable detailed construction cost estimating.   Appropriate use can enable stakeholders (owners, design/builders, oversight groups) to  set more realistic project budgets,  provide better insights into cost uncertainties, and  mitigate potential cost overruns, leading to more successful project deliveries.
Predictive Construction Cost Data
Summary
Terms like “predictive cost analysis” and “predictive cost data” is an idealized concept, often used in marketing due to the fact that real-world variables introduce significant uncertainty
The challenges and uncertainties involved in accurately forecasting construction costs, when dealing with dynamic real-world variables limit the value of predictive models, and a degree of caution is always warranted

Challenges to accurate cost forecasting

  • Incomplete or Inaccurate Data: Predictive models rely heavily on historical data. If this data is incomplete, outdated, or inaccurate, the predictions derived from it will be compromised. 
  • External Factors: Market volatility, economic shifts, and unexpected events like pandemics, geopolitical conflicts, or natural disasters can significantly impact material prices, labor availability, and overall project timelines and costs, making accurate long-term forecasting difficult.
  • Complexity: Large and intricate construction projects involving numerous stakeholders, complex designs, advanced technologies, and diverse trades are difficult to forecast accurately. Factors like hidden obstacles, poor soil conditions, and unforeseen structural flaws can also dramatically increase costs beyond initial estimates.
  • Labor Shortages and Productivity: Fluctuations in the availability of skilled labor, changing wage rates, and unpredictable productivity levels can significantly affect labor costs and project timelines, posing a challenge to accurate estimations.
  • Scope Changes and Change Orders: Design revisions, unforeseen site conditions, material availability issues, or evolving project goals can lead to significant changes in project scope and subsequent cost overruns if not managed carefully.
  • Lack of Integration and Collaboration: Inefficient communication and a disconnect between field teams and office personnel can lead to discrepancies in project data, resource misallocation, and difficulties in tracking actual costs against the budget

The path towards addressing uncertainty and improving cost visibility
While absolute certainty in construction cost forecasting remains an elusive ideal, incorporating strategies to manage uncertainty and improve cost estimation is crucial for project success.

Detailed Project Planning: Comprehensive project planning, including detailed schedules, identification of potential risks, and outline of mitigation strategies, forms a strong foundation for more accurate estimates.

Thorough Risk Assessment: Identifying potential financial risks, evaluating external variables, and involving key stakeholders in the risk assessment process can help to anticipate and manage cost impacts.

Historical Data Analysis: Leveraging historical data from similar projects can offer valuable insights into potential drivers, informing future estimates.

Contingency Planning: Building contingency reserves into project budgets helps to absorb unforeseen expenses and mitigate the impact of unexpected cost fluctuations.

Technology and Estimation Software: Advanced estimation software can enhance accuracy and efficiency by automating calculations, providing real-time data, and facilitating risk analysis. Tools like 4BT Benchmark Construction EstimatorTM  integrated with current granular cost data can further improve cost visibility and mangement.

Communication and Collaboration: Open communication and effective collaboration among project stakeholders, including clients, contractors, and suppliers, are essential for ensuring that all parties are aligned and aware of any changes that may impact costs.

Regular Monitoring and Adjustment: Estimates are not static and require continuous monitoring and adjustments based on actual data to ensure that projects remain within budget and on time.  Fluctuations in material prices (e.g., steel, lumber, concrete), labor costs, and fuel costs can significantly impact projects. These prices can change rapidly due to factors like global supply and demand, economic shifts, or unforeseen events.

← Back

Thank you for your response. ✨

Construction Cost Visibility

Construction Cost Visibility requires the open and honest sharing of a project’s costs between parties, such as a contractor and client, to build trust and improve outcomes. 

It involves detailed breakdowns of expenses (materials, labor, equipment), regular budget updates, early risk identification, and collaborative problem-solvingBenefits include informed decision-making, lower final costs through value engineering and better risk management, stronger client-contractor trust, and enhanced public confidence in government projects. Transparency can be achieved through methods like integrated project delivery (IPD) and collaborative job order contracting combined with objective, granular, and current standardized cost data, with  visibility into project spending and empowering participants and stakeholders to manage projects and costs effectively. 

What Construction Cost Transparency Involves
  • Detailed Cost Breakdowns:
    Presenting itemized estimates for materials, labor, equipment, costs with associated productivity information.
  • Open Communication:
    Consistent and honest dialogue between all stakeholders about project scope, costs, and expectations. 
  • Regular Updates:
    Providing routine budget reports and cost tracking information to keep all parties informed. 
  • Early Risk Identification:
    Proactively highlighting potential cost escalation factors to allow for early intervention and value engineering. 
  • Collaborative Problem-Solving:
    Working together to address budget challenges as they arise, rather than facing unwelcome surprises later. 
Benefits of Construction Cost Transparency
  • Builds Trust and Collaboration

    Fosters stronger relationships between contractors and clients through a two-way sharing of cost information. 

  • Informed Decision-Making:

    Empowers clients to make better choices regarding materials, suppliers, and project scope by providing visibility into costs. 

  • Cost Control:

    Enables proactive cost management, helps to identify cost-saving opportunities, and minimizes unexpected cost overruns. 

  • Improved Project Outcomes:

    Leads to better project delivery, higher client satisfaction, and a stronger final product. 

  • Enhanced Public Trust:

    In government projects, transparency helps to reduce allegations of corruption and misuse of funds, bolstering public confidence. 

How Transparency is Achieved
  • Detailed Estimates:

    Providing comprehensive, line-item estimates that are clear, standardized, and verifiable. 

  • Collaborative Delivery:

    Teams work together from the outset to solve problems and manage costs transparently from the pre-construction phase. 

Examples and Initiatives 

  • LEAN Construction IPD and Job Order Contracting Tools and Services – Software, Unit Price Books, Training and Support promotes the disclosure, validation, and interpretation of data for physical infrastructure projects to improve accountability.

Construction Cost Visibility

← Back

Thank you for your response. ✨

Federal Stewardship of the Built Environment

Federal Stewardship of the Built Environment

Executive Summary

Federal stewardship of the built environment requires disciplined, transparent, and sustainable management.

Requisite cost visibility and cost management are grounded in granular, objective, and verifiable local market data for labor, materials, and equipment. Without this foundation, federal projects risk systemic inefficiencies, inflated costs, and erosion of public trust.

  1. The Government’s Stewardship Obligations
  • Ensure Cost Accuracy – Use local market–researched, objective, and verifiable cost data instead of generalized national averages or outdated sources.
  • Promote Transparency – Maintain clear, auditable connections between scope, quantities, and costs.
  • Detect and Prevent Overbilling – Employ data-driven analytics to identify inappropriate line items, excessive quantities, or misapplied cost factors.
  • Verify Compliance – Ensure projects adhere to contract terms, procurement rules, and applicable laws.
  • Measure Performance – Track vendor responsiveness, quality, schedule adherence, and estimating accuracy.
  • Support Continuous Improvement – Use reliable cost data to refine cost estimating, project planning, and delivery efficiency.
  • Protect Public Funds – Apply lifecycle cost analysis to achieve maximum taxpayer value.
  1. The Critical Role of Cost Visibility and Cost Management

Cost visibility — the ability to see and verify every cost component — depends on accurate, granular data for local labor, materials, and equipment. Without this, cost management is reactive at best, and systemic errors are inevitable.

Table 1 – Benefits of Cost Visibility Using Granular, Local Data

Benefit Description
Transparency Owners and stakeholders can verify estimates against objective, locally researched labor, material, and equipment costs.
Accuracy Eliminates errors caused by national averages or outdated cost indices, ensuring location-specific estimates.
Accountability Clear cost breakdowns support effective contract administration and performance monitoring.
Trust All parties share the same verifiable cost information, fostering collaboration.

Table 2 – Cost Management Advantages of Objective, Verifiable Data

Advantage Impact
Better Budget Control Prevents cost overruns by basing budgets on actual local conditions.
Improved Decision-Making Enables informed trade-off evaluations between scope, quality, and cost.
Risk Reduction Reduces disputes by removing subjective or arbitrary pricing.
Continuous Improvement Allows tracking of cost trends for future planning and performance benchmarking.
  1. Current Shortcomings
  • Deferred Maintenance Backlogs – GAO reported federal civilian and DoD backlogs ballooned from $171B in 2017 to $370B in 2024.
  • Underused and Poorly Tracked Assets – Agencies retain costly, underutilized facilities.
  • National Average Pricing – Many agencies rely on generic national cost data, introducing significant error.
  • Incomplete Adoption of Sustainable Practices – Executive Order 13514 goals are far from universally met.
  1. Recommendations
Objective Action Steps
Ensure Cost Accuracy Mandate use of verifiable local cost databases. Discontinue national-average cost books.
Promote Transparency Publicly link every cost line item to a documented scope and quantity.
Prevent Overbilling Use AI-enabled audits to flag anomalous costs against the verified local baseline.
Verify Compliance Require post-project compliance audits.
Measure Performance Implement vendor scorecards tracking estimating accuracy.
Support Continuous Improvement Use aggregated cost data trends to update estimating standards annually.
Protect Public Funds Require lifecycle cost analysis at the planning stage of all capital projects.
  1. Conclusion

Federal stewardship demands more than maintaining facilities — it requires financial stewardship grounded in fact. Only with granular, objective, and verifiable local market cost data can the government achieve true cost visibility, effective cost management, and sustainable outcomes. Failure to adopt this approach perpetuates waste, inflates costs, and undermines public trust.

Federal Stewardship of the Built Environment

References

  • GAO-25-108400: Federal Real Property – Condition and Deferred Maintenance Challenges (2025)
  • GAO-25-108159: Federal Real Property – Opportunities for Improved Utilization and Disposal (2025)
  • GAO-25-108028: Real Property Management – High Risk Area Updates
  • Executive Order 13514 – Federal Leadership in Environmental, Energy, and Economic Performance
  • GAO-23-105905 – Sustainable Federal Facilities: Practices and Progress

Established in 2016, Four BT, LLC. (“4BT”) is a certified veteran-owned small business (VOSB) focused upon providing objective, verifiable, and current local market construction cost data, associated secure cloud-based technology for construction cost estimating and professional support services.  Data is organized via expanded CSI MasterFormat as well as the expanded UNIFORMAT dependent upon the use.

We are championing a future where everyone can make informed choices about the quality of the data that powers your repair, renovation, maintenance, and new build Planning, Procurement, and Project Delivery Process.

To unlock the full potential of efficient lifecycle management of the built environment and achieve economic and environmental benefits, we must prioritize openness, reliability and set the highest standards for cost and technical data and associated information sharing.

We must all prioritize TRUST.


← Back

Thank you for your response. ✨

AUDITS and JOC Program Public Sector Stewardship

AUDITS and JOC Program Public Sector Stewardship – Job Order Contact audits are critical to ensuring public sector stewardship, the responsible management and care of public resources and institutions, with a focus on long-term sustainability and the public goodIt involves a duty of care for the capability, people, knowledge, systems, and assets of the public service, as well as the legislation it administers. Essentially, it’s about ensuring that public resources are used effectively and ethically, for the benefit of both current and future generations. 


Download JOC Program Checklist


  • Ensure Cost Accuracy – Verify that all line items in the Unit Price Book (UPB) match objective, current, and locally researched cost data, avoiding inflated or outdated pricing.
  • Promote Transparency – Demonstrate clear, traceable links between scope, quantities, and costs, building trust among stakeholders.

  • Detect and Prevent Overbilling – Identify discrepancies such as inappropriate line items, excessive quantities, or misapplied coefficients.
  • Verify Compliance – Confirm that JOC projects follow contract terms, procurement rules, and applicable laws or regulations.

  • Measure Performance – Assess contractor responsiveness, work quality, schedule adherence, and cost control to support performance-based contract renewals.

  • Support Continuous Improvement – Provide data-driven insights to improve estimating accuracy, process efficiency, and future project delivery.

  • Protect Public Funds – Ensure taxpayer or organizational funds are spent appropriately and deliver maximum value.AUDITS and JOC Program Public Sector Stewardship
    Tenants of public sector stewardship.

  • Long-term perspective:

    Stewardship requires thinking beyond short-term gains and considering the long-term impacts of decisions on the public good. 

  • Resource management:

    It involves the careful and responsible management of public funds, assets, and other resources. 

  • Accountability and transparency:

    Public sector stewards are accountable for their actions and decisions and must operate with transparency. 

  • Sustainability:

    Stewardship emphasizes the need to ensure the long-term viability and effectiveness of public institutions and services. 

  • Service orientation:

    It involves prioritizing the public interest and serving the needs of citizens. 

  • Upholding the public trust:

    Public sector stewards are entrusted with the public’s trust and are expected to act with integrity and ethical behavior. 

  • Focus on capability and capacity:

    Stewardship also involves building and maintaining the long-term capability and capacity of the public service. 

  • Working with others:

    Stewardship often involves collaborating with various stakeholders, including citizens, other government agencies, and the private sector. 

In essence, public sector stewardship is about ensuring that the public good is protected and advanced through responsible and ethical management of public resources and institutions.
Learn more about 4BT’s approach to Job Order Contracting!

← Back

Thank you for your response. ✨

Government Construction Early Contractor Involvement

Collaborative Project Delivery (Integrated Project Delivery and Collaborative Job Order Contracting) both involve Government Construction Early Contractor Involvement (ECI)

  • Non-traditional Program-centric versus Project-centric Administration
  • Robust Focus Upon Preconstruction – Early and ongoing team collaboration (owner, design/builder, planning/procurement/project delivery)
  • Improved Design Quality – Constructability
  • Objective, verifiable, current, standardized, local market granular cost data
  • Increased understanding of market conditions
  • Pricing feedback from industry during design development
  • Fast Tracking
  • Earned Value Management Focus
  • Shared risk of cost increases
  • Mitigated change orders and disputes
  • 90%+ On-time/On-budget/Quality outcomes
  • Contractor incentivized to collaboratively work with Government team to meet cost objectives

Early contractor involvement ensures consistent quality, timely delivery, and cost control for government real property owners.


.
Here’s how ECI helps ensure quality, timely delivery, and cost control:
  • Improved quality and constructability: Contractors can provide valuable input during the planning and design process, identifying potential issues and proposing solutions to improve the design’s buildability and overall quality. This can result in better-informed design decisions, leading to fewer errors and rework during the construction phase.
  • Reduced delays and enhanced schedule management: Early involvement allows contractors to contribute to the development of a more accurate and realistic project schedule. By identifying potential bottlenecks and planning for long-lead items, ECI helps to minimize delays and keep projects on track.
  • Improved cost control and budgeting: Contractors can provide realistic cost estimates and identify cost-saving opportunities through value engineering during the design phase.  When combined with the use of locally researched granular cost data more accurate budgets, reduced risk of cost overruns, and efficient resource allocation are enabled.
  • Stronger risk management and mitigation: ECI allows for early identification and assessment of potential risks related to the project, enabling the project team to develop strategies for their mitigation or transfer. This proactive approach to risk management can prevent costly delays and disputes later in the project lifecycle.
In essence, ECI fosters collaboration and communication between all project stakeholders (owner and design/builder planning, procurement, and project delivery teams) from the outset. This helps to align expectations, address challenges proactively, and ultimately leads to a higher probability of delivering successful government real property projects – on time, within budget, and to the desired quality standards.

← Back

Thank you for your response. ✨

Build a Strong Cost Data Foundation

Build a Strong Cost Data Foundation – Strategies for Change

A significant issue in public sector capital planning and associated repair, renovation, maintenance, and construction is the reliance on outdated, national average cost data and flawed location/economic multipliers. This reliance limits cost visibility and creates inefficiencies in estimating, budgeting, and executing projects.

Key friction points include institutional inertia, regulatory policies, misinformation, and overconfidence in legacy methods.

To move forward and toward action, the following strategic changes can be implemented.

Viable Strategies for Change

1. Policy and Procurement Reform

Barrier Addressed: Institutional Inertia, Procurement Standards, Regulatory Compliance

  • Revise procurement language to focus on ‘objective, current, and locally verifiable cost data’ rather than naming legacy data providers.
  • Require that cost data be granular (task-based), updated quarterly, and traceable to local labor, material, and productivity rates.
  • Advocate through legislative or executive channels for updates to standards (e.g., FAR, GSA, FEMA, DOE, VA) that currently default to outdated cost data sources.

Build a Strong Cost Data Foundation

2. Educate and Train Key Stakeholders

Barrier Addressed: Lack of Awareness, Resistance to Change

  • Launch targeted awareness campaigns for public sector leaders, planners, and procurement officers showing the comparative accuracy of local market data over national averages.
  • Offer cost-free webinars and workshops using standardized frameworks like expanded CSI MasterFormat® and expanded UNIFORMAT as approriate to demonstrate minimal learning curves and implementation costs.
  • Highlight case studies where switching to granular local data (e.g., via Four BT, LLC / 4BT) improved cost control and project outcomes.

3. Mandate Cost Transparency and Auditability

Barrier Addressed: Illusion of Predictive Accuracy, Poor Cost Controls

  • Require all estimates and capital plans to use detailed unit price line items, not lump sums or factored historical data.
  • Implement third-party validation protocols that compare actual vs. estimated costs using locally researched data as the baseline.
  • Make cost data and project estimates auditable, traceable, and exportable for long-term portfolio and capital improvement planning.

4. Integrate Modern Cost Management Systems

Barrier Addressed: Technical Obsolescence

  • Deploy cloud-based, collaborative cost estimating platforms that incorporate real-time pricing updates and integration with asset management and project delivery tools.
  • Favor systems that support LEAN construction methods like collaborative and open Job Order Contracting (JOC) and Integrated Project Delivery (IPD)—both of which rely heavily on transparent, shared data environments.
  • Ensure compatibility with other systems (ERP, CAFM, CMMS, IWMS, BIM) to create an integrated digital planning ecosystem.

5. Pilot and Scale Through Phased Implementation

Barrier Addressed: Perceived Risk, Organizational Inertia

  • Launch pilot programs in select agencies, districts, or campuses using a Four BT-style cost data foundation.
  • Measure outcomes in terms of budget accuracy, change orders, schedule adherence, and owner satisfaction.
  • Use documented success to justify scaling through internal and external stakeholder buy-in.

Final Thoughts

Transformation requires data-driven decision-making, leadership courage, and cultural change. The outdated reliance on national averages and economic multipliers isn’t just inefficient—it’s costly and avoidable.

Public sector owners need not wait for top-down mandates. With tools like Four BT’s locally researched cost database and standardized cost structures (e.g., expanded CSI MasterFormat), change can begin today—internally, pragmatically, and affordably.

Reach out and request and informational session.


← Back

Thank you for your response. ✨

Innovative Lower Cost JOC Solution

Is your organization ready for an Innovative Lower Cost JOC Solution?


Innovative Lower Cost JOC Solution


#1. 4BT provides the most cost effective job order contracting tools and services available and a responsive support staff.

  • Reduce administrative costs.
  • Costs reflect local market conditions.
  • Manage projects with a greater confidence.

#2. 4BT exclusively provides local market cost data, tools and services to enable verifiable project costing, superior cost visibility, and superior cost management capability.

  • Improve Project Control: Gain local market labor, material, equipment and productivity visibility to manage projects proactively from day one.
  • Enhance Decision Making: Make informed decisions based on realistic, verifiable cost projections and time requirements.
  • Reduce Delays and Overruns: Mitigate change orders to prevent project delays and cost overruns.
  • Better Resource Utilization: Allocate resources efficiently to optimize productivity and reduce waste.
  • Increase Stakeholder Confidence: Transparent proposals and  reporting builds trust among owner and design-builder project teams.
  • Scalable Solutions: Secure cloud technology hosted on Microsoft Government Cloud Environment.  CMMC-LvL 2 compliant for DoD applications.

Via ChatGPT – 20250703

🟢 1️ Four BT, LLC

Best For:

  • Owners and contractors seeking comprehensive, locally researched, line-item cost data (over 90,000 tasks)
  • Detailed pricing that supports Job Order Contracting (JOC), Progressive Design-Build, and LEAN frameworks
    How They Source Data:
  • Actual local market surveys of labor, materials, and equipment in each target region
  • Updates quarterly
    Why It’s Different:
  • Not just an index factor applied to a national baseline—Four BT develops custom localized cost books in partnership with owners and agencies.
  • This is currently the most widely used U.S. solution for verified local cost data in the JOC space.
    Where to Learn More:
    👉 Four BT – www.4bt.us

You have used 4Clicks and RSMeans Online, as well as ProEst, Sage, STACK, WinEst, and similar tools.

What are the Challenges with these and Other “Market Leading” Tools:
– 4Clicks and RSMeans Online: Reliance on national averages daused disconnect from local market realities thus lacking the needed granularity for precise data.
– ProEst, Sage, STACK, WinEst, and similar tools: Emphasize functionality over accurate local market cost data, creating gaps in precise cost management.


4BT develops, markets, and fully supports an Innovative, Lower Cost JOC Solution for savvy real property owners and design/builders who wish to outperform their peers.


“All trademarks referenced here are the property of their respective owners. Four BT, LLC is not affiliated with, endorsed by, or sponsored by any owners of the respective trademarks.”

Key considerations when choosing construction cost data

Key considerations when choosing construction cost data
  • Accuracy and Reliability: Prioritize sources with local market research, detailed line-item breakdowns, and frequent updates. National average data, even with location factors, may not fully capture local market nuances. Independent studies and publications have noted that relying solely on national averages with City Cost Index adjustments can lead to inaccuracies in estimating project costs for specific locations.
  • Level of Detail: Do you need conceptual estimates based on square footage or granular breakdowns of labor, materials, and equipment?
  • Geographic Specificity: Local market data offers greater precision by accounting for local labor rates, material prices, regulations, and other factors that influence costs.
  • Frequency of Updates: Real-time data is essential for accurate estimates in dynamic markets.
  • Integration with Software: Consider how the data integrates with your estimating or project management software.
  • Company Expertise and Support: Choose a provider with a track record of accuracy, transparency, and customer service.
Leading providers and their strengths
  • Four BT, LLC (4BT) OpenCOSTTM: Focuses on locally researched construction cost data, providing detailed line-item breakdowns based on specific labor, material, and equipment costs. Prioritizes transparency and is particularly useful for projects using LEAN construction, Job Order Contracting (JOC), or Integrated Project Delivery (IPD) approaches.
  • RSMeans Data Online: Offers a comprehensive database of construction cost data and advanced features like square foot models and predictive cost data. While RSMeans provides localization factors and aims for accuracy, Four BT, LLC notes that it’s crucial to understand the limitations of national averages when estimating project costs for specific locations.
Additional resources
  • Construction Estimating Software: Many software platforms incorporate or integrate with cost data, such as Procore or Buildxact.
  • Construction Industry Associations: Organizations like the Association for the Advancement of Cost Engineering and the American Society of Professional Estimators provide valuable resources and certifications for estimators.
Ultimately, the choice of the best construction cost data depends on your specific project and the level of accuracy required for the given location.
Source of above: Google AI Mode – https://www.google.com/search?q=best+construction+cost+data&sca_esv=ff452058d59b7f49&rlz=1C1VDKB_enUS1066US1067&sxsrf=AE3TifMK7q2uVGLOABVaQLUYIRjWPj4z9Q%3A1752175945192&ei=SRVwaNW9C8zY5NoPg-234QU&ved=2ahUKEwib5_vg0LOOAxWBFlkFHXBDNsUQ0NsOegQIYBAA&uact=5&sclient=gws-wiz-serp&udm=50&fbs=AIIjpHxU7SXXniUZfeShr2fp4giZ1Y6MJ25_tmWITc7uy4KIemkjk18Cn72Gp24fGkjjh6xLbYFZ8GT1BuPL80sm6IbhfoHKnZSnR1I7vykvC7VeP6xJFouHHaKsUepfOlVYGYNNMtsFaaoT88p5n8uCDD3GEUCSXdbJB08yYIyVMTUeTAWDPInldiQniRyvAhmHVkQhA3cRC_0lb0TAdeBZlnp7hMMBzQ&aep=10&ntc=1&mstk=AUtExfAEQZigt9dKjeNTyL2lCMAXmeFFN9AwiOfvJZhm2csIvravJh-hjfhfb0kUXsTLhOy9cE9vnhzf3IH2TR-mix0Xj8CFUVz-TmvaQE3h-82bhmfKfteWGpaPuFPnuTBL_9191t8S3fWw1f9rEbCwbU4VPpgJ8VOxDuiVbRBaLhVjRD_ZoHBcKIzQvNhic6yPZX2h00LqqhkbsiTc4ihCAT9ZaNJH7R0o63590f6JO6lRD8AnZS_I_OO7TU134TPpWCsB2xfh-RsmirBxwSNH4cWhS0cnEJbiVH7zBa_cJ0SAn-SXkDFjDPY_qJ4ENdcF4Tc99tVRtvjpRRam4dedVnLdtRYrmQGKJzPWJsQfRjZlDnGQUfqhMQ8a0RJ9in1J2mTKO184Chj2umX2rxiOBiwPwBfyMCl6YQ&csuir=1 20250719
Note:  All trademarks and rights remain solely with their respective owners.  No endorsement of any kind is given or implied.

local market construction cost data

← Back

Thank you for your response. ✨


Role of Pre-Construction in Success

The Critical Role of Pre-Construction in Success

Pre-construction is the phase of a project where the greatest influence on cost, schedule, and quality outcomes can be achieved. Decisions made during this stage have long-lasting impacts throughout the lifecycle of the facility. Effective pre-construction planning is especially critical for repair, renovation, maintenance, and new construction projects, where cost control and schedule adherence are essential.

The following foundational elements enable consistent, high-quality project execution—on time and within budget:


1. Implementation of a Robust, Collaborative, and Integrated Planning, Procurement, and Project Delivery Framework

To avoid cost and schedule overruns, owners must adopt a consistent, repeatable process for managing projects. This involves integrating planning, procurement, and delivery activities under a single framework that emphasizes collaboration, transparency, and shared risk/reward. Examples include Job Order Contracting (JOC) and Integrated Project Delivery (IPD), both of which promote early engagement of stakeholders, open-book pricing, and continuous improvement.

🔍 Reference:

  • “Integrated Project Delivery: A Guide” – AIA National and AIA California Council

  • Four BT LLC – 4bt.us (JOC solution provider with LEAN alignment)

  • Lichtig, W.A. “The Integrated Agreement for Lean Project Delivery,” 2005.


2. Development of a Clear, Detailed Scope of Work (SOW) Based on Locally Researched, Granular Construction Task Data

An accurate and detailed SOW is the cornerstone of successful project execution. This requires:

  • Current and locally researched unit price data for each task

  • Granular task-level detail, including labor, materials, equipment, and productivity rates

  • Organization according to a standard data architecture, such as an expanded CSI MasterFormat (e.g., 50 divisions, 16-digit level detail)

local construction data

Using objective cost data ensures transparency, minimizes scope creep, and enables verifiable cost estimation and control. Owners should avoid outdated or generalized national average data, such as RSMeans, which may introduce errors exceeding 30% in localized pricing.

🔍 Reference:

  • Four BT Construction Cost Database (90,000+ line items; updated quarterly; CSI MasterFormat-based)

  • Construction Specifications Institute – CSI MasterFormat 2020 Edition

  • “Why Construction Cost Data is Not a Commodity,” ChatGPT (2025), Link


Conclusion

Owners that consistently apply these two core principles—a collaborative project delivery framework and a detailed, data-driven SOW—achieve better outcomes across all types of construction projects. The pre-construction phase offers the opportunity to set expectations, define value, manage risk, and align teams, making it the most critical stage for long-term success.

← Back

Thank you for your response. ✨

Construction Cost Data is Not a Commodity

The flowing information sourced from ChatGPT (20250708 – https://chatgpt.com/c/686dbe24-aefc-8012-bc35-6784a780b0af ) highlights why construction cost data is not a commodity.
Note:  All trademarks and rights remain with their respective owners and no endorsements of any kind are implied or given.


“You’re absolutely right—construction cost data is not a commodity, and treating it as such leads to major issues in project planning, budgeting, and delivery, particularly when accuracy and accountability are critical.

Despite this, RSMeans continues to be widely used, especially in the public sector, for several key reasons:


1. Legacy Status and Institutional Inertia

RSMeans has been around for over 80 years and is deeply embedded in many public agency workflows, contract templates, and procurement standards. It’s often referenced in policy documents, scopes of work, and federal/state/local guidelines—not because it’s the best tool, but because it has been historically accepted.

“We’ve always used it” remains a powerful (if flawed) justification.


2. Perceived Objectivity and Risk Aversion

Public agencies tend to be highly risk-averse. RSMeans offers a third-party, “independent” database, which is seen as neutral. This provides political and procedural cover in case of disputes or audits.

Even if it’s not accurate locally, it checks the compliance box.


3. Lack of Awareness or Access to Better Options

Many procurement and facilities personnel are unaware that more current, locally researched, and granular cost databases (e.g., Four BT) exist. Others may know but lack the authority or technical support to implement them.

There’s a major knowledge and training gap in many agencies regarding alternatives.


4. Bundled Tools and Marketing

RSMeans is now part of Gordian, which markets not only cost data but also full software ecosystems and JOC procurement platforms. Agencies are often sold these systems as complete solutions, reinforcing continued use of the RSMeans dataset, regardless of its limitations.

The tool and data are often bundled, making the cost database harder to swap out independently.


5. Misunderstanding of Localization and Accuracy

RSMeans uses national averages adjusted by cost indices (CCI/LCI), but this does not equate to actual local market pricing. Yet many believe that the adjustment factors make it sufficiently local and current—which is rarely true.

This misunderstanding leads to systematic under- or over-estimating, often by 30–40%.


6. Procurement Convenience > Project Accuracy

RSMeans offers a fixed reference, which can simplify the procurement process, even if it’s not reflective of true market conditions. This can expedite contracting—especially in low-bid environments—but at the cost of scope clarity and financial performance.

Convenience often trumps precision when deadlines and compliance pressures dominate.


Summary:

Public sector reliance on RSMeans is driven less by merit and more by legacy use, compliance culture, lack of education, and system lock-in. Until there is broader recognition that objective, locally validated cost data is essential to LEAN project delivery and fiscal responsibility, RSMeans will remain in use despite its technical shortcomings.

Note:  All trademarks and rights remain with their respective owners and no endorsements of any kind are implied or given.

Request information about objective, current, verifiable, and detailed local market construction cost data.

construction cost data is not a commodity

← Back

Thank you for your response. ✨

Facility Lifecycle Management Framework

A robust facility lifecycle management framework is critical to ensuring positive financial and environmental outcomes.

A robust facility lifecycle management framework represents a strategic approach to managing an organization’s physical assets to achieve better outcomes at lower risks and costs involves optimizing the use, maintenance, and lifecycle of facilities and their components, ensuring they are effectively tracked, maintained, and utilized. This leads to improved efficiency, reduced costs, extended asset life and mitigation fo environmental impact. 

Core Principles:
  • Proactive Risk Mitigation:

    .

    Focus on anticipating and mitigating potential risks associated with facility ownership, rather than just reacting to problems as they arise. 

  • Cost Optimization:

    .

    By effectively managing assets, organizations can reduce operational and maintenance costs, avoid unnecessary purchases, and extend the lifespan of assets. A requisite tool is current objective, verifiable, and granular locally researched costs organized within a standardized data architecture.

    Facility Lifecycle Management Framework

  • Strategic Decision Making:

    .

    A framework for making informed decisions about asset acquisition, maintenance, and disposal, based on data and performance analysis. 

  • Alignment with Organizational Goals:
    Ensure that facility management practices are aligned with the organization’s overall mission and objectives. 
Key Benefits:
  • Reduced Operating Costs:

    .

    By implementing preventative and predictive maintenance strategies, organizations can minimize downtime, reduce energy consumption and other negative environmental impacts, and lower repair costs. 

  • Increased Asset Lifespan:

    .

    Effective asset management can significantly extend the useful life of facilities and equipment, delaying or eliminating the need for costly replacements. 

  • Improved Safety and Compliance:

    .

    A well-managed facility ensures a safer and more compliant environment for users in concert with the organizational mission.

  • Enhanced Efficiency and Productivity:

    .

    Optimized asset management leads to smoother operations, reduced downtime, and increased productivity across the organization. 

  • Better Decision-Making:

    .

    Access to current actionable data on asset performance and condition allows for informed decision-making throughout the asset lifecycle.

    ← Back

    Thank you for your response. ✨

Construction Cost Analysis

A reliable Construction Cost Analysis requires objectivity, currency, and detailed research of the local market.

Analytical review of available information clearly demonstates the importance of current, locally researched cost data when compared to national market average cost data and the associated use of cost factors.    Using verifiable, current, and granular local market cost data is a proven methodology and a strategic benefit to both owners and design builders that allows for defensible cost estimates with improved cost visbility and cost management capability.

Objective comparsions of locally researched cost data and issues associated with national average cost data and location factoring are shown below.

#1. – “Location factors are used during preliminary project evaluations. They are not intended to be used when preparing appropriation-quality estimates. They often are applied to conceptual estimates for identifying “go/no-go” projects at an early stage.” (Peitlock, B.A., ccc, Developing Location Factors Using a Factoring Method, International Cost Engineering Council, ICEC International Cost   Management Journal (ICMJ), 1998.)

#2. Location factors are primarily used in class 4 and 5 estimates and are not intended to be used for higher quality estimates, such as class 3, 2, or 1. The RSMeans city cost index (CCI) and the Department of Defense area cost factor (ACF) index are two primary examples of location factor publications. (Martinez, A., Validation of methods for adjusting construction cost estimates by project location , University of New Mexico UNM   Digital Repository, 2010)

#3. “Despite its potential weaknesses, estimation by adjustment factors is a very common approach for all types of construction. A very common approach for performing quick-order-of-magnitude estimates is based on using Location Cost Adjustment Factors (LCAFs). The accuracy of cost estimates in the early phases varies within an expected range that spans from -100% to +200% ” “Using the results of this study, various commercial entities (e.g., RS Means) could enhance their online tools by uploading publicly available socio-economic variables and allowing users to perform geostatistical analysis. As a result, a cost engineer could input the location of a project and obtain the most accurate location adjustment factor through a mix of interpolation and geostatistical prediction techniques.” (Migliaccio, G., Empirical Assessment of Spatial Prediction Methods for Location Cost Adjustment Factors, J Constr Eng Manag. 2013)

#4. “Problems within the methodology, unfortunately, will continue to arise as standardized estimation tools (CCI) simply cannot account for the unique characteristics of individual states.  Unfortunately, the accuracy of program-wide CCIs occasionally led to swings of ±20 percent after projects had gone through the bidding process. Additionally, no direct application of market or economic conditions existed in this conventional CCI process, which was theorized by FHWA to potentially be a significant influence on resulting project estimate accuracy. ”    (University of Colorado Denver College of Engineering and Applied Science Department of Civil Engineering, Validation of Project-level   Construction Cost Index Estimation Methodology, 2017


DoD Construction Estimating

Construction Cost Analysis

Granular local market cost data


4BT OPENBuild2025Join us as we pave the way toward a new future for public and private sector efficient project delivery using Job Order Contracting, Integrated Project Delivery, and objective, verifiable, current local market cost data.    Help shape an innovative yet provn approach to repair, renovation, maintenance, and new build planning, procurement, and projecdt delivery where empowerment and choice fuels collaboration and mutually beneficial outcomes.  Established in 2016, Four BT, LLC. (“4BT”) is a certified veteran-owned small business  (VOSB) focused upon providing objective, verifiable, and current local market construction cost data, associated secure cloud-based technology for construction cost estimating and full related support services.  Data is organized via expanded CSI MasterFormat.

We are championing a future where everyone can make informed choices about the quality of the data that powers your repair, renovation, planning, and new build Planning, Procurement, and Project Delivery Process.   To unlock the full potential of efficient lifecycle management of the built environment and achieve the economic and environmental  benefits, we must prioritize openness, reliability and set the highest standards for cost and techincal data and associated information sharing.  We must prioritize TRUST.

  • Estimate project costs comprehensively – Ensure budgets reflect the actual current local market labor, material, and equipment costs  for successful project delivery.
  • Create detailed and realistic project timelines – Identify key milestones, task dependencies, and critical paths.
  • Minimize risks associated with delays and budget overruns – Provide a clear project roadmap and cost control mechanisms.
  • Enhance resource allocation and utilization – Align resources and scheduling with budget constraints.

www.4bt.us

← Back

Thank you for your response. ✨

Costs Effective JOC Programs

Job Order Contracting (JOC) programs can be cost-effective for organizations needing to complete multiple, often recurring or small-to-medium-sized construction projects. 
Here are core elements and benefits of cost effective JOC Programs:
  • Reduced Administrative Costs: JOC eliminates the need for repeated bidding and contract processes for each project, significantly reducing administrative burdens and associated costs.  [Note: Paying a percentage of JOC construction volume as a fee for JOC products or services can prove costly and negate any potential cost savings.]
  • Time Savings: JOC can save time compared to traditional methods due to pre-established contracts and potentially faster project starts.
  • Predictable Budgeting: JOC utilizes a Unit Price Book (UPB)with preset, pricing for construction tasks. This enhances cost transparency and allows for more accurate budgeting and financial planning, helping avoid budget overruns. [Note: Cost data should be objective, current, verifiable, organized by expanded CSI Masterformat, and locally researched to ensure optimal cost visibility and cost management capability. The use of national average cost data, location factors, or static cost books is not recommended.]
  • Improved Cost Control: JOC provides enhanced cost control and transparency, enabling organizations to better manage project budgets and ensure resources are utilized effectively.  [Note: It is important that real property owners be directly involved in managing the JOC Program.  The excessive use of “JOC Consultants” can negatively impact the benefits associated with a JOC Program.]
  • Streamlined Processes: By centralizing information and integrating teams, JOC can streamline planning, procurement, and project delivery, leading to increased efficiency and potential cost savings.
  • Specific Providers: Companies like Four BT, LLC specialize in providing JOC solutions and offer cost-effective options and tools. Four BT, LLC specifically highlights their cost-effective nature, support for owners and design-builders, and current, dynamic, locally researched cost data. 
It is important to note:
  • While and owner-managed JOC Program can be a valuable tool for cost-effectiveness, it might not be the most cost-effective solution for owners spending less than $2M-$3M in total annual JOC Program spend.
  • The effectiveness and cost-effectiveness of any JOC program depend on factors like its implementation, contract management, and propery utilization of the UPB.

local market construction cost data Lean Accounting 1

Granular local market cost data
Costs Effective JOC Programs

← Back

Thank you for your response. ✨

Cost reliability and transparency in your Construction Estimating Process

Remember: Striving for construction cost reliability and transparency in your construction estimating process, rather than absolute accuracy, will lead to more effective project management and ultimately, better results. 
Achieving 100% accuracy is generally impossible due to numerous variables affecting final costs and the lack of a verifiable reference point (a datum). The goal should be to create reliable and verifiable constructon Estimating Process based on the best available data. 
Here are some key aspects of acquiring and using construction cost data:
1. Focus on Local vs. Localized Data:
  • Local market labor, material, and equipment costs are paramount.

Cost reliability and transparency

  • Using national averages or outdated data can lead to inaccuracies.  The use of location factors or areas cost factors cannot meet the cost visibility levels of locally research labor, material, and equipment costs.

Construction Cost reliability and transparency

Cost reliability and transparency

  • Contacting local suppliers, subcontractors, or other contractors can provide up-to-date information, 9r procure locally researched construction cost data.
2. Cost Data Providers:
  • RSMeans Data (Gordian): Widely used in the industry available in various formats including an online platform, however, provided as a national average dataset and localized using the City Construction Index.  
  • Four BT, LLC: Offers a local market cost database focused on detailed construction tasks, emphasizing curent, objective, and verifiable granular data.  90,000+ line items.
  • Xactware: Specializes in cost data for insurance and restoration, but also provides general construction databases.
  • Craftsman Book Company: Provides resources like the “National Construction Estimator,” often used as a starter.
  • BNI – National average cost data. 
3.  Construction Cost Indices:
  • These indices track price changes over time and can help adjust historical data for current market conditions, however, best used for gross budgetary purposed.
  • Examples include the Mortenson Construction Cost Index (by city), indices provided by the US Army Corps of Engineers and the Bureau of Reclamation, and RSMeans City Cost Index.
  • Note that location factors and cost indexes are primarily used for preliminary estimates and may not be sufficient for detailed cost visibility. 
4. Keep Data Updated:
  • Construction costs fluctuate frequently due to market conditions, inflation, and other factors.
  • Regularly update your cost data, quarterly is recommended, and monitor trends to ensure appropriate changes.
6. Use Construction Estimating Software:
  • Software platforms can integrate cost data, streamline the estimating process, and improve accuracy.
  • Cloud-based / SaaS access to the cost data can assist in improving collaboration and information sharing among owners, designers, and builders as well as proper oversight.
7. Understand Cost Components:
  • Break down project costs into major groups like materials, labor, equipment, associated with productivity for granular construction tasks.


local market construction cost data

Why “accurate” applied to cost estimates is problematic:
  • Lack of a True Datum: To determine accuracy, you need a known, fixed point of reference or “datum”. Construction projects, with their inherent complexities, fluctuating market conditions, and potential for unforeseen issues, lack such a definitive datum.
  • Variable Factors: Numerous variables influence the final cost of a construction project, including planning, procurement, project delivery methodology, site-specific challenges, unforeseen conditions, and scope changes. These factors make it impossible to predict the exact final cost with absolute certainty at the outset.
  • Misleading Comparison to As-Built Costs: Comparing an estimate to the final as-built cost is not a reliable measure of accuracy because the as-built cost is influenced by many factors that go beyond the initial estimate.

Focusing on Reliability and Verifiability:
Instead of aiming for unattainable “accuracy,” the focus should be on creating objective, reliable and verifiable construction cost data and estimates based upon local market conditions.
  • Reliability: A reliable estimate is trustworthy and consistently produced with high quality data and methods.
  • Verifiability: A verifiable estimate can be validated based on the information used to create it, including objective, granular, and locally researched cost data.

Key Characteristics of Reliable and Verifiable Cost Data and Estimates:

  • Objective: Based on factual information and independent research, rather than subjective opinions or hidden factors or indeterminate calculations.
  • Verifiable: Allows for validation of costs by providing documentation and data supporting the estimates.
  • Detailed/Granular: Broken down into specific line items for individual construction tasks with an associated unit of measure (UoM) providing transparency and visibility into cost components.
  • Current: Reflects current local market labor, material, and equipment costs.
  • Locally Researched: Specific to the project’s geographic location, considering local market conditions and factors.
  • Consistent Data Architecture: Organized using standardized classification systems like enhanced CSI MasterFormat, as well as enhanced UNIFORMAT as appropriate, which enhances consistency, communication, and overall project management, as well as lowering ongoing data reuse and maintenance costs.
By focusing on these characteristics, you can develop cost data and estimates that are more reliable and actionable, even if they cannot be “accurate” in the strictest sense of the word. This shift in perspective is crucial for better cost visibility, management, and ultimately, more successful construction outcomes.

Granular local market cost data

All tradesmarks and rights remain the with their respective owners and no endorsement is implied or given.
Request more information….

← Back

Thank you for your response. ✨

MOST Construction Cost Data is Useless

Construction Cost Data Insight

Adequate construction cost insight is foundational to improving repair, renovation, maintenance, or new build outcomes for both owners and design/builders.

For decades, the construction industry has clung to the idea of “accurate estimates” as the gold standard for planning, budgeting, and managing capital projects.

This belief persists across owners, designers, and contractors—despite overwhelming evidence that such precision is not just elusive, but fundamentally flawed.
There’s no such thing as an “accurate estimate”

Let’s be clear: an estimate is a forecast—not a fact.

It is inherently uncertain because it anticipates future costs based on current inputs, evolving design, shifting scopes, and unpredictable market conditions. Estimates can be: – Detailed – Verifiable – Objective – Current – Based on real local market conditions
…but never truly accurate.

And the sooner we stop perpetuating the myth of accuracy, the more effective our cost management practices will become.

Construction Cost Data Insight

The Real Foundation of Cost Reliability: People, Process, and Information
While technology is often viewed as the solution to cost challenges, it is not the primary
driver of successful cost outcomes. Instead, it is the people involved, the processes they
follow, and—most critically—the information they use that determine project success,
especially in the complex realms of repair, renovation, maintenance, and new construction.

Why Granular Local Data is Non-Negotiable
At the core of reliable estimating lies detailed, localized information. Construction costs are
deeply influenced by regional labor markets, material availability, equipment access,
weather conditions, and local regulations.

Key Requirements for Reliable Estimates.…   Request the full white paper.

← Back

Thank you for your response. ✨

Granular local market cost data

4BT (Four BT, LLC) is an exclusive provider current, objective, granular local market cost data organized using expanded CSI MasterFormat, with over 90,000 lines as well as having similar data for preventive maintenance tasks with checks for each activity frequency.

4BT cost data is available with supporting cost estimating technology or for hosting within certain third-party OEM software applications.

4BT’s unique enables owners to validate contractor bids as well as design/builders to be more confident in their proposals.   The availability of verifiable locally researched cost data addresses the most common  challenges owners and design/builders face, the development and sharing of reliable construction cost estimates.

With uncertain material costs across different trades, and rapidly changing labor costs, having access to verifiable and current cost data is critical for reducing risk and overall project success.

Owners and Builders

Stop struggling with common estimating issues…  labor, trade-level cost inaccuracies, outdated material pricing, and sole reliance upon subcontractor bids, historical costs, or national average cost data and location factoring.

  • See clear descriptions, written in plain English for each construction task.
  • See associated labor, material, and equipment cost and productivity information per unit of measure for each construction task.
  • Easily create your own line items
  • Build assemblies from line items

Four BT, LLC
Four BT, LLC, founded in 2016, is a certified veteran-owned small business.   It’s founders have previously worked for RSMeans/Gordian and VFA/Gordian and 4Clicks/Gordian and have experience working with and supporting major institutions from all sectors and billions of dollars in repair, renovation, maintenance, and new build activities.

Why Local Market Construction Cost Data Matters

Granular local market cost data

Granular local market cost data

← Back

Thank you for your response. ✨


Project cost estimation levels – Construction

Project cost estimation levels depend on the amount of current, actionable information available about the project at a given stage.

As a repair, renovation, maintenance, or new build activity progresses and the scope becomes more defined, the estimates become more reliable.

#1. Rough Order of Magnitude (ROM) Estimate / Class 5 Estimate:
Purpose: Used in the early stages of project planning (0-5% project definition) for screening or feasibility studies, often for initial budgeting.
Reliability Range: Wide range, typically -50% to +100%.
Method: Relies on historical data, expert judgment, and scaling from similar projects.
Confidence: Low, used for rough estimations to assess feasibility.

#2. Feasibility Estimate / Class 4 Estimate:
Purpose: Determines the feasibility of a project and supports the go/no-go decision.
Reliability Range: More refined than ROM, typically -30% to +50%.
Method: Based on about 5-20% project definition, focusing on the minimum detail needed to make a decision.
Confidence: Moderate.

#3. Preliminary / Budget Estimate / Class 3 Estimate:
Purpose: Aids in choosing between different project options and sets initial budgets.
Reliablity Range: Narrower than feasibility estimates, typically -10% to +25%.
Method: Based on approximately 10-40% project definition and analyzes different product configurations and features.
Confidence: Increasing, but still subject to revision.

#4. Substantive / Bid Estimate / Class 2 Estimate:
Purpose: Provides a detailed breakdown of costs for a well-defined project.
Reliability Range: Typically -15% to +20%.
Method: Involves detailed cost analysis of all project components, including labor, materials, and equipment.
Confidence: High, used for detailed planning, bidding, and control.

5. Definitive / Control Estimate / Class 1 Estimate: Project cost estimation levels
Purpose: Represents the most accurate estimate, used for final budgets, control, and managing variations.
Reliability Range: Highest accuracy, typically -5% to +10%.
Method: Based on extensive project details (50-100% definition), often involving vendor quotes and finalized plans.
Confidence: Very high, but subject to change orders and unforeseen circumstances.

Important Considerations:

Actionable Data:  Objective, current, local market data, organized via a standard data architecture improves estimate reliability and communication among all participants and stakeholders.
Progressive Elaboration: Project cost estimation levels become more reliable as the project progresses and more information is available.
Contingency: Contingency is crucial, as it accounts for unforeseen events, regardless of the estimate’s reliability.
Methods: Different techniques like bottom-up estimating contribute to the reliability level.


← Back

Thank you for your response. ✨


Preconstruction Process Improvement

Preconstruction process improvement can significantly increase the number of project completed on-time and on-budget per client requirements.


A robust pre-construction process involves defining the project’s scope, estimating costs, developing a detailed schedule, and ensuring compliance with relevant regulations

It also includes contractor selection, risk analysis, and a comprehensive and collaborative communication plan. 

Here’s a more detailed look at the key components:

1. Scope Definition: Clearly outlining the project’s objectives, deliverables, and requirements is crucial. This includes defining the project’s boundaries, goals, and needs to ensure everyone understands the project’s scope and its limits.   Standardization in terms of using common industry standard terms and data formats is a must.  An example is expanded CSI Masterformat for detailed line time construction tasks, inclusive of labor, material, equipment, and productivity details.  All associated data must be specific to local market conditions.  Download more information on detailed SOW development and best practices.

2. Cost Estimation: Developing accurate cost estimates is essential for setting the project budget. This involves estimating material, labor, equipment, and overhead costs in concert with consideration of the local market and productivity information.  Using an verifiable, current local market cost database significantly improves cost visibility and cost management capability.

Construction Advanced Work

3. Project Scheduling: Creating a detailed project schedule that outlines key milestones, task durations, and dependencies helps manage the project timeline and ensure timely completion. 

4. Permitting and Regulatory Compliance: Securing necessary permits and adhering to local, regional, and national statutes/regulations is a crucial step in the pre-construction phase. 

5. Design Development: Refining the design and ensuring it aligns with the project’s objectives and requirements is an important aspect of pre-construction. 

6. Contractor Selection: Choosing the right contractor is essential for project success. This involves evaluating bids, assessing qualifications, and selecting a contractor who can effectively manage the project and who is both service oriented and interested in developing a long-term relationship. 

7. Risk Analysis and Mitigation: Identifying and mitigating potential risks is crucial for preventing delays and cost overruns.  An often overlooked primary method of risk mitigiation is selecting the appropriate construction delivery method.  A fully transparent, collaborative method that focuses upon obtaining best value for both real property owners and design-builders is generally the most beneficial to all participants and stakeholders. 

8. Communication Plan: Establishing a clear communication plan helps ensure that all stakeholders are informed and aligned.  Again, the important of an integrated and collaborative approach (examples, collaborative job order contracting, integrated project delivery) with respect to Planning, Procurement, and Project Delivery and a common data environment play a significant role in improving communication and mitigating errors, omissions, and misunderstandings.

9. Procurement: Developing a clear procurement strategy ensures that materials and services are procured efficiently and on time.   It is critical the Procurement teams collaborate on an early and ongoing basis with Planning, and Project Delivery teams internally and externally.   

10Site Evaluation:  Site visits with services providers is a must.   Assessing the site for feasibility, including soil conditions, utilities, and environmental factors, is a critical step in pre-construction. 

11. Feasibility Study: Conducting a feasibility study helps determine the viability of the project and identifies potential challenges. 

12. Value Engineering: Exploring opportunities for cost-saving without compromising project quality is a key aspect of pre-construction.  This first required a thorough understanding of costs at “base level” without design-builder profit and overhead.  This is best accomplished using a third party local market granular database.

13. Project Planning: Developing a comprehensive project plan that outlines all aspects of the project, from initial concept to completion, is essential for success. 

14. Documenting the Pre-Construction Phase:Maintaining detailed digital records of all pre-construction activities and decisions is important for tracking progress and resolving any issues that may arise during construction.   Preferably a collaborative construction delivery method is being used and all phases of the construction lifecycle are maintained and managed in a standardized manner.
Preconstruction process improvement provides the highest potential return on investment and increases the likelyhood of successful project outcomes for an repair, renovation, maintenance, or new build activity.

Capital Project Management Solution – Built Environment

Good people, a robust process, and actionable information are critical to capital project management.

A proactive focus upon People, Process, Information, & Enabling Technology has proven to be the only pathway to efficient capital project management on a consistent basis.  While technology is an enabler, is should not be considered a solution, nor be a key driver in decision-making.


People – Process – Information – Technology

  • Consistent, capable, and accountable real property owner leadership
  • Service-oriented skilled teams working toward mutually beneficial outcomes
  • Shared, objective, standardized, current, and local market information (i.e. granular locally researched cost data)
  • Technology that supports process, improves consistency, and enables monitoring

Capital Project Management

Capital Project Management


1. Enhanced Accountability and Transparency

  • Clear roles and responsibilities supported by standardized cost frameworks ensure team members are accountable for deliverables.
  • Regular, data-informed monitoring and reporting keep stakeholders fully engaged and aware of project progress and performance.
  • Objective cost visibility eliminates guesswork, strengthening trust and oversight.

2. Informed and Streamlined Decision-Making

  • Decision-making is faster and more effective when grounded in current and localized cost data.
  • Defined authority levels ensure the right people are empowered to act with confidence.
  • Data-driven governance mitigates the risks of delays, scope creep, and misalignment.

3. Improved Project Execution

  • Accurate, detailed cost data allows for precise scheduling, budgeting, and resource planning.
  • Teams collaborate more effectively when they share a single source of truth regarding costs and priorities.
  • Execution aligns with realistic targets—minimizing inefficiencies and rework.

4. Proactive Risk Management

  • Objective and localized cost intelligence enhances early identification of budgetary and logistical risks.
  • Governance frameworks define clear procedures for evaluating and responding to risks.
  • Teams can implement mitigation strategies before cost or schedule impacts occur.

5. Increased Project Success and Predictability

  • Projects grounded in verifiable, standardized cost data are more likely to meet defined scope, budget, and timeline goals.
  • Predictable outcomes increase stakeholder confidence and improve alignment with strategic objectives.
  • This disciplined, data-informed approach enhances overall organizational performance.

Origins of Percent Plan Complete in Construction

The historical origins of percent plan complete (PPC) began with the Department of Defense, with later focus by Glenn Ballard and the LPS (Last Planner System).

The U.S. Department of Defense (DoD) employed performance measurement techniques akin to Percent Plan Complete (PPC) well before its formalization in the Lean Construction Institute’s Last Planner System during the 1990s. While the term “Percent Plan Complete” may not have been explicitly used, the foundational concepts were embedded in earlier DoD project management practices.

Early DoD Performance Measurement Practices

  1. Earned Value Management (EVM):
    Initiated in the 1960s, EVM was a pivotal method for integrating scope, schedule, and cost parameters in DoD projects. It emphasized measuring work progress against a baseline plan, calculating metrics like Planned Value (PV), Earned Value (EV), and Actual Cost (AC). These metrics facilitated assessments of schedule and cost performance, inherently involving comparisons between planned and completed work.

  2. Cost/Schedule Control Systems Criteria (C/SCSC):
    Established in 1967, C/SCSC provided a standardized approach for contractors to manage and report project performance. It mandated detailed planning and tracking of work packages, ensuring that the percentage of work completed could be quantitatively assessed against the plan.

  3. Construction Quality Management (CQM):
    The U.S. Army Corps of Engineers and NAVFAC implemented CQM programs emphasizing the importance of planning and executing work as scheduled. These programs required contractors to develop and adhere to quality control plans, which included tracking the completion of planned activities.

NAVFAC’s Role in Performance Tracking

The Naval Facilities Engineering Systems Command (NAVFAC) has long been instrumental in managing military construction projects. NAVFAC’s Planning, Design, and Construction (PDC) Directorate oversees the delivery of facility and infrastructure solutions, ensuring projects are executed according to established plans and schedules.

While specific documentation detailing the use of PPC terminology within NAVFAC’s historical records is limited, the organization’s emphasis on meticulous planning and adherence to schedules aligns with the principles underlying PPC.

Conclusion

In summary, the DoD’s historical project management frameworks incorporated performance measurement techniques that paralleled the concepts of Percent Plan Complete. These methodologies focused on planning work, executing as scheduled, and measuring performance against the plan—core tenets of PPC. The formalization and popularization of PPC within the Lean Construction Institute’s Last Planner System built upon these foundational practices, tailoring them to the construction industry’s collaborative and continuous improvement needs.

yet that knowledge is note enough to

← Back

Thank you for your response. ✨

Local Construction Costs

Local construction costs are now available to real property owners and builders.

A unit price book must be valid, reliable, and verifiable  to objectively and realistically represent current local market conditions.


Owners, builders, and oversight groups now have the ability to….


#1.  Source current, LOCAL MARKET commercial construction cost data Scope of Work


#2.  Measurably improve Cost Visibility and Cost Management capabilities


#3.  Evaluate and validate bids / proposals with verifiable cost data for materials, labor,  equipment, and task level productivity 


#4.   Create and share a detailed Scope of Work


  • Reduce Risk by Eliminating Guesswork: Clear visibility into granular line-item repair, renovation, maintenance, or new build tasks.
  • Support LEAN and Value Management Principles: Value management require insight into local market conditions.
  • Adaptable to Market Realities: Dynamic cost data, updated quarterly, assists in adapting to market fluctuations.

Local Construction Costs

preventive maintenance

yet that knowledge is note enough to

← Back

Thank you for your response. ✨

DoD Fraud – GAO Report April 2025

Addressing DoD Fraud has been an unsolved problem for decades, yet department expenditures of $850 Billion+ annually are invovled.

The DoD represents approximately half of Congress discretionary spending and 82%+ of the U.S. Government’s physical assets.  Approximately  $10.8 Billion has been confirmed as fraud, with actual levels likely much higher.

Despite decades of GAO Reports and recommendations, the extent of fraud affecting DOD is simply not known and will not be until the DOD implements a comprehensive antifraud strategy.    In fact, the DoD has not passed a financial audit in decades.

The U.S. Department of Defense (DoD) has never passed a full financial audit. Since 2018, when it became legally obligated to complete full annual audits, the DoD has received a “disclaimer of opinion” on each audit, meaning that its financial records are in such poor condition that auditors couldn’t form a comprehensive assessment.

DoD Fraud


DoD remains a high-risk areas as designated by the GAO.  (GAO, High-Risk Series: Heightened Attention Could Save Billions More and Improve
Government Efficiency and Effectiveness, GAO-25-107743 (Washington, D.C.: Feb. 25, 2025).

Specific to facilities and the built environment, the DoD has not true cost visibility or cost management capability as it still largely relies upon national average cost data, location factoring, historical data, and contractor estimates.    This is unacceptable when objective, detailed line item local maket cost data is readily available.

Robust and integrated planning, procurement, and project delivery processes that are collaborative and transparent could save 30%-40% of associated built environment related activities.

via 4BT.US – Efficient Project Delivery Systems for the Built Environment


Construction Value Engineering and Cost Estimating

Construction Value Engineering and Cost Estimating go hand in hand.

Simply put, value engineering is a process intended to balance between function, performance, quality, safety and cost. The appropriate balance in alignment with organizational requirements results in the maximum value for the project.

Arguably Integrated Project Delivery, Collaborative Job Order Contracting, Alliance Partnering, and similar project delivery methods represent value engineering applied to built environment repair, renovation, maintenance, or new construction projects.   All represent frameworks to enable the systematic application of function-oriented techniques by multi-disciplined teams to analyze and improve the value of the associated planning, procurement, and project delivery teams and phases.  All are structured to mitigate unnecessary cost and associated quality issues or time delays.

While traditional value engineering applied to construction projects have been shown to provide cost savings in the range of %5-20%, construction-specific implementation can enhance cost visibility and cost management by 30%-40%+, especially when integrated with objective, current, and granular local market line-item construction task data complete with labor, material, equipment and productivity details.

Construction Value Engineering

Construction Value Engineering

Learn more?

← Back

Thank you for your response. ✨

Facilities Preventive Maintenance Cost Management

Facilities Preventive Maintenance Cost Management framework helps to both spend dollars more efficiently and better support your organization’s mission.


Improve facilities, systems, and component availability and improve life-cycle cost management.


⭐ Improve facilities, systems, and component availability and improve life-cycle cost management.

⭐ Gain true cost visibility for your local market preventive maintenance requirements, including labor and material details.

⭐ Better prepare PM schedules and labor requirements.

⭐ Validate bids/proposals from PM services providers.

⭐ Access checklists for each system and associated time-based event, based upon industry standards.

⭐ Improve compliance and monitoring for both operations in-house and outsourced.

⭐ Determine the total PM cost for a facility based upon you inventory list.

⭐ Learn why most CMMS implementations fail.


This innovative approach to PM cost management and compliance is avialable exclusively from Four BT, LLC (4BT).

Reach out to learn more about how to gain cost visibility, improve cost management, and gain better control of you facility maintenance strategy.

preventive maintenance cost database

Facilities Preventive Maintenance Cost Management

Facilities Preventive Maintenance Cost Management Facilities Preventive Maintenance Cost Management

← Back

Thank you for your response. ✨

Real Property Capital Plan – Federal Government

A robust and consistently applied real property capital plan has been missing across the federal government sector for decades.   GSA in particular have failed at the most basic level and to this day does not leverage objective, standardized, granular, local market labor, material, and equipment information to develop detailed and actionable scopes of work.   That said, the same is true for all federal departments and agencies.

Strategic and operational physical asset planning, procurement, and project delivery has been long neglected, resulting in billions of dollars of financial and environmental waste.

The root cause is a fundamental lack of senior management leadership, capacity, and accountability, and NOT those actually doing the work.   As Deming makes very clear, most problems in organizations stem from flawed systems and processes, not from the workers themselves.   


The purpose of Capital Planning is for Federal agencies to effectively plan, procure, and use assets throughout their life cycle and eventually dispose of assets to achieve maximum return on investment consistent with government policies.


Real Property Capital Plan
Real Property Capital Plan FRAMEWORK

← Back

Thank you for your response. ✨

FAST and RELIABLE Cost Estimates


A robust built environment capital planning process must be fully integrated with any federal organizational budget development and subequent procurement and project delivery activities to provide the best investment return and protect the taxpayer interest.

Cost Estimate Risk – Associated with the accuracy of the cost estimate and whether the alternative is well defined – and associate cost visibility and cost management remains a critical issue yet to be addresed.


1. Federal Organizations Are Slow and Inefficient in Pre-Construction

2. Execution Today is Just a Mess

3. Projects Are Too Expensive and Cost Management is Ineffective

4. Governance Is Eroding


Construction Cost Estimating Improvement

The ability to access current, objective, and granular labor, material, and equipment costs on a local level represents a significant Construction Cost Estimating Improvement.

Benefits

  1. Superior Cost Visibility
  2. Improved Cost Management
  3. Detailed Scope of Work Development
  4. Fewer Errors and Omissions


Every successful project rests upon a foundation of robust process, skilled teams, reliable tools, and actionable information. 


Owners, design-builders and oversight groups no longer have to rely soley on national average cost data, location factoring, contractor quotes, or historical information.

Unlike traditional cost databases that rely upon national or regional averaging and use location factors or area cost factors, 4BT detailed line-item construction cost data uses LOCAL MARKET labor, material, equipment costs and productivity based upon commercial standards and up to date crew information.  The net result a 30%-40%+  improvement in cost representation.

Additionaly, 4BT cost data is updated quarterly versus creating “annual cost books”,  a common practice among traditional cost data providers.  A annual update cycle  does not account for “real-time” local market fluctuations, which can lead to inaccuracies, especially in the volatile market situation so prevalent today.


Whether it’s improving processes, getting most out of your construction dollars, ensuring a reasonable profit margin, or simply meeting your fiduciary responsibility, we can help.

Let’s work together to make it happen.

← Back

Thank you for your response. ✨


The 4BT OpenCost(TM) construction cost database is available within a supporting cloud technology platform, PDF, or Microsoft Excel (TM) to qualified users.

Physical infrastructure development should be underpinned by transparent planning, procurement, and project delivery, sharing of actionable information, and decision-making processes that facilitate meaningful, inclusive and participation among owners, architects, engineers, and builders.

Learn more here.

Sample Estimate:

Standardized Cost Data

Cost Estimate Validity


How to Create an Independent Government Cost Estimate

What is an Independent Government Cost Estimate?

An IGCE (also in construction related service an IGE) is a cost estimate developed by the Government Requiring Activity, based on the requirements of the Performance Work Statement (PWS) or Statement of Work (SOW). An IGCE is required for every new acquisition that exceeds the simplified acquisition threshold (SAT), or as otherwise specified.

How to Create an Independent Government Cost Estimate

✅ Objective, verifiable, current and granular local market cost data (no use of location factors or economic indexes)
✅ Well defined Statement of Work Support informed negotiations
Standardized Data Architecture and Work Breakdown Structure (WBS) using industry standard terms, descriptions, and definitions  (expanded CSI Masteformat and/or expanded UNIFORMAT)
Early and ongoing collaboration with Planning, Procurement, and Project Delivery Teams
✅ Experienced line-item construction cost estimators
✅ Detailed market research and full transparency throughout established processes

An independent government estimate or appropriate review of a contractor’s detailed line-time estimate for any repair, renovation, maintenance, or new construction activity are consistent with best management practice, if not a regulatory requirement to ensure fiduciary responsibility of the government organization.

Technical planning and professional procurement team collaboration and adherence to robust best management practices are needed to mitigate financial and environmental waste.   Sole focus upon “rapid procurement” and or maintaining the ‘status quo’ are both barriers to efficient lifecycle management of the build environment.

Five primary questions to be answered are:
1. How was the estimate made?
2. What assumptions were made?
3. What information/tools were used?
4. Where was the information obtained from?
5. How did previous estimates compare with prices paid?

Independent Government Cost Estimate
SAMPLE – Independent Government Cost Estimate


Independent Government Cost Estimate Process

← Back

Thank you for your response. ✨


Other considerations

#1. Some key statutes that govern the acquisition of products and services are:

  • Competition in Contracting Act (CICA),
  • Davis-Bacon Act (DBA), Federal Acquisition Reform Act
    Federal Acquisition Streamlining Act (FASA)
  • Javits-Wagner-O’Day Act (JWOD)
    Procurement Integrity Act, Service Contract Act (SCA)
  • Small Business Act.

#2. Total Ownership Cost (TOC) in Services Acquisition is defined as the sum of financial
resources needed to organize, train, support, sustain, manage, and operate the contract service
requirement while meeting mission goals, policies, and standards of readiness, environmental
compliance, safety, and quality of life concerns.

#3. The format and content of the IGCE will differ based on the type, complexity, and value of the
acquisition. The IGCE consists of the anticipated costs to include direct costs (labor, products,
equipment, travel, and transportation), indirect costs (burden on labor such as fringe benefits and
labor overhead), material overhead, general and administrative (G&A) expenses, and profit.

Direct Costs. As defined at FAR 2.101, direct cost means any cost that is identified specifically
with a particular final cost objective. Costs identified specifically with a contract are direct costs
of that contract.
Labor Costs are typically the most significant part of the IGCE in terms of dollars for either
services or construction contracts. Direct labor is the labor directly applied to the performance
of the contract requirements. The IGCE should identify the labor categories and the number of
hours required to perform the work, known as level of effort, for each category. Market
Research is necessary to determine the appropriate labor category and labor mix that supports
the PWS or SOW. Consideration should also be given to the geographical location and site

(Government versus contractor facility) in which the work will be performed.
In contracts for services and construction, direct labor may be covered by the Department of
Labor wage determinations (see References Section for links) and is considered non-exempt
(typically blue collar, but may cover some white-collar occupations, such as clerical, that do not
require a professional license or college degree). As non-exempt employees, they must be paid
no less than delineated on the associated wage determination or collective bargaining agreement
(CBA). The provisions that govern non-exempt are the Service Contract Act (SCA) for services
or the Davis-Bacon Act (DBA) for construction. The SCA Directory of Occupations and the
Bureau of Labor Statistics (see Reference Section for links) provide labor categories,
descriptions, and historical wage data. In contrast, management and professional salaried staff,
are not covered by a wage determination and are considered exempt (white collar occupations
that typically require a professional license or college degree). As exempt employees, they will
receive benefits and wages comparable to those in industry and Government.

Note: 4BT construction cost date includes “fringe costs” for all associated trades and are researched locally and independently.  Contractor profit and overhead are NOT included.

#4. An IGCE can contain any combination of cost estimation methods and expert opinions. The four
primary cost estimation methods used to develop cost estimates are:
Analogy (Top Down)
 Estimates are based on historical data of a similar item/system.
 Adjusts the known costs by adding or subtracting elements of material, time, and
economic or inflationary changes as necessary.
 Generally less costly and less time-consuming than other methods, but also generally
less accurate.
 Example: In the past when landscaping at location “A” was purchased, it was $20,000
for 100,000 square feet; therefore, estimates are made based on similar acquisitions.
Parametric (Statistical)
 Relies on statistical analysis to establish a relationship between a technical
characteristic and the cost of the system.
 When there is a simple mathematical relationship between two tasks/elements, it
is known as “Factor” cost estimating. For example, initial set-up is 10% of the
operation and maintenance cost.
 Measurable base units may include man-hours, trips, moves, units, and square feet.
 Use in early planning stages of a contract service when specific tasks/elements are not
yet known.
 Example: Painting: 500 square feet x $15 per square foot = $7,500.
Engineering (Bottom Up)
 Estimates are very detailed, separated into tasks/elements.
 The cost of individual tasks and elements are estimated to the greatest level of specified
detail.
 The task/element costs are then summarized or “rolled up” to higher levels.
 Cost and accuracy influenced by the size and complexity of tasks/elements.
 Example: An enterprise-wide telephone system with switches, components, and
handsets.
Actual Costs (Extrapolation)
 Typically associated with tasks/elements in progress or material items when taking the
actual cost of previous production lots.
 Adjusted for inflation, labor saving, production and technology changes, and other
factors.
In the absence of one of the four primary cost estimates, the MFT may have to rely on the
following cost estimation method:
Expert Opinion
 Relies on subject matter experts’ opinion of what something should cost.
 Typically used as a last-resort method.

#5. General Best practices
 Employ a Team Approach to include members of the Project / Technical Team, Procurement/Contracting,
General Counsel, and other stakeholders as appropriate.
 Understand the Requirement.
 Be sure to follow the internal review and approval processes.
 Be sure to:
• Engage early and often with other members the team.
• Thoroughly document IGCE methodologies, assumptions, sources, and calculations.
• Ensure estimate reflects the period of performance, inflated properly for multi-year
IGCEs and/or otherwise adjusted (example: updating unit price cost data regularly)
• Ensure current and detailed market research,
• Include the standard cost elements (e.g., direct labor, material, and equipment cost data sources), but also tailor to
meet specific needs.
• Ensure that the estimate is updated, as appropriate.


Subpart 5107.90– Independent Government Estimates

5107.9000Scope.

This subpart prescribes policy for the preparation of independent government  estimates.

5107.9001Definitions.

“Independent government  estimate (IGE),” as used in this subpart, means the Government’s estimate of the projected price or cost that a contractor would incur in the successful performance of a contract.

5107.9002Policy.

(a)  Contracting officers shall require the preparation of an IGE in every procurement action in excess of the simplified acquisition threshold (SAT).  The Contracting officer, at his or her discretion, may require an IGE for actions less than the SAT.

(b)  The Contracting officer shall ensure, prior to accepting an IGE, that—

(1)  The IGE contains enough detail to verify the validity of the offerors’ proposals;

(2)  The IGE provides sufficient narrative and analytical detail, to include reference material, to support its preparation;

(3)  The IGE contains a certification that the Government independently developed the IGE prior to seeking formal proposals from contractors, or for construction, within a timeframe consistent with FAR 36.203; and for architect-engineer, consistent with FAR 36.605; and:

(i) Be signed and dated,  by hand or by Common-Access-Card (CAC), by the preparer,  and includes the preparer’s organization, position, title, and telephone number;

(ii)  Be signed and dated,  by hand or by CAC, by the preparer’s immediate supervisor, and includes the reviewer’s organization, position, title, rank or grade, and telephone number.


IGCE Handbook – https://www.acq.osd.mil/asda/dpc/cp/policy/docs/sa/DoD_IGCE_for_SA_Handbook.pdf


36.203Government estimate of construction costs.

(a)An independent Government estimate of construction costs shall be prepared and furnished to the contracting officer at the earliest practicable time for each proposed contract and for each contract modification anticipated to exceed the simplified acquisition threshold. The contracting officer may require an estimate when the cost of required work is not anticipated to exceed the simplified acquisition threshold. The estimate shall be prepared in as much detail as though the Government were competing for award.

(b)When two-step sealed bidding is used, the independent Government estimate shall be prepared when the contract requirements are definitized.

(c)Access to information concerning the Government estimate shall be limited to Government personnel whose official duties require knowledge of the estimate. An exception to this rule may be made during contract negotiations to allow the contracting officer to identify a specialized task and disclose the associated cost breakdown figures in the Government estimate, but only to the extent deemed necessary to arrive at a fair and reasonable price. The overall amount of the Government’s estimate shall not be disclosed except as permitted by agency regulations.

36.207Pricing fixed-price construction contracts.

(a)Generally, firm-fixed-price contracts shall be used to acquire construction. They may be priced-

(1)On a lump-sum basis (when a lump sum is paid for the total work or defined parts of the work),

(2)On a unit-price basis (when a unit price is paid for a specified quantity of work units), or

(3)Using a combination of the two methods.

(b)Lump-sum pricing shall be used in preference to unit pricing except when-

(1)Large quantities of work such as grading, paving, building outside utilities, or site preparation are involved;

(2)Quantities of work, such as excavation, cannot be estimated with sufficient confidence to permit a lump-sum offer without a substantial contingency;

(3)Estimated quantities of work required may change significantly during construction; or

(4)Offerors would have to expend unusual effort to develop adequate estimates.

(c)Fixed-price contracts with economic price adjustment may be used if such a provision is customary in contracts for the type of work being acquired, or when omission of an adjustment provision would preclude a significant number of firms from submitting offers or would result in offerors including unwarranted contingencies in proposed prices.


36.210Inspection of site and examination of data.

The contracting officer should make appropriate arrangements for prospective offerors to inspect the work site and to have the opportunity to examine data available to the Government which may provide information concerning the performance of the work, such as boring samples, original boring logs, and records and plans of previous construction. The data should be assembled in one place and made available for examination. The solicitation should notify offerors of the time and place for the site inspection and data examination. If it is not feasible for offerors to inspect the site or examine the data on their own, the solicitation should also designate an individual who will show the site or data to the offerors. Significant site information and the data should be made available to all offerors in the same manner, including information regarding any utilities to be furnished during construction. A record should be kept of the identity and affiliation of all offerors’ representatives who inspect the site or examine the data.


Better Performing JOC Program

A better performing JOC Program requires focus upon implementation and committment to a collaborative and integrated planning, procurement, and project delivery framework.   The identification of processes, desired outcomes, and associated information requirements is foundational to a efficient and effective JOC Program.

Sole focus upon Procurement, an unfortunately trend with many current JOC Programs, can lead to more costly projects and a disconnect between owner and design-builder needs.

4BT OpenJOC (TM) Framework


Better Performing JOC Program
Path to a Better Performing JOC Program


A better performing JOC Program requires a focus upon implementation and collaborative planning, procurement, and project delivery teams.

Reach out to discuss.

← Back

Thank you for your response. ✨


Capability Development – STRATEGY DEVELOPMENT & DEPLOYMENT

Strategy without tactics is the slowest route to victory.  Tactics without strategy is the noise before defeat.”  – Sun Tzu

  • Planning, Procurement, and Project Delivery
    • Review current processes and resources
    • Define goals and objectives
    • Quantify risks and obstacles
    • Create workflows and documentation
    • Embed processes into supporting technology
    • Support program and personnel requirements
    • Establish and monitor quantitative performance measures
  • Business Process Re-engineering
  • Creating Value and Actionable Insights
  • Cost Savings
  • JOC / IQC / IPD Program Development and Support
  • Workflow Optimization4BT provides an experienced professional team that will assist with configuring, implementing, and supporting a best value JOC Program or IPD Framework. Our team reports directly to the real property owner and is available to assist owners and awarded design-builders throughout the JOC Program/IPD Project lifecycle.
    • Quantify objectives and outcomes
    • Identify the organizational capabilities needed to achieve measurable improvement
    • Develop and maintain collaboration among internal and external teams
    • Process/role integration

Exclusive Source of Local Market Cost Data – 90,000+ Line Items for Repair, Renovation, Maintenance, and New Construction

4BT (Four BT, LLC) is your Exclusive Source of Local Market Cost Data – 90,000+ Line Items for Repair, Renovation, Maintenance, and New Construction.

local market construction cost data

Consider the following…
What are your primary sources of cost data?
How do you ensure currency and completeness of data?
Does your data reflect current, local market conditions?
How do you manage and share your data?
How often do you refresh your cost data?
Do you have multiple sources and current commercial construction standards to validate your data?
Is your data based upon time/motion studies of granular construction tasks?

Request our data sheet or a Teams meeting!

← Back

Thank you for your response. ✨

DoD Construction Estimating

DoD Construction estimating can be significantly improved with the use of local market, objective, and current construction cost data.

Historically many DoD sites have use “national average” cost data and have attempted to localize information with “area cost factors” and/or other forms of “cost indexes”.   This traditional method can introduce significant errors in cost estimation as demonstrated by several independent sources.

The primary issue associated with construction cost location factoring is Data Accuracy.  Inaccurate data can lead to incorrect cost estimates. Cost data must be up-to-date, and reflect local market conditions (labor, material, and equipment), at a granular level.  The application of factors to an estimate introduces significant error as the method cannot account for a wide range of variances.

Whether new builds, repairs, renovation, or maintenance, including preventive maintenance, the use of local market, current and verifiable granular cost data can significantly improve cost visibility and cost management.

If you are a DoD department or agency and wish to beging a journey to save 30%-40% of construction, renovation, repair, or maintenance costs, reach out to schedule an educational online meeting or reach our capability statement.

FAST and RELIABLE Cost Estimates
commerical cost

DoD Construction Estimating

Four BT, LLC
CAGE/NCAGE: 7RB80
84 COTTONWOOD LN
NAPLES, FL 34112-7230 USA
www.4bt.us
[email protected]
903.326.9965‬

Additional Information;

While construction cost factors are widely used for estimating project costs, there are several challenges and potential problems associated with their use. Here are some common issues:

  1. Regional Variations: Construction cost factors rely on regional averages. Local variations in labor costs, material prices, equipment availability, and regulatory requirements can greatly affect the estimate. If your project is in an area with significantly different market conditions, estimates may be poor.
  2. Project Size and Scale: Cost factors may not scale linearly with the size or scale of a project. Large or complex projects may have different economies of scale, and cost factors may not accurately reflect these variations.
  3. Limited Detail: Cost factors are often broad and generalized, providing average values for various  construction aspects or categories. This lack of detail can be a limitation for most projects that generally require a more detailed breakdown of costs.
  4. Inflation and Economic Changes: Economic factors, such as inflation rates, can impact construction costs over time. Cost factors may not account for these changes, leading to significant discrepancies between estimated and actual costs.
  5. Technology and Innovation: Advancements in construction technology and methodologies may not be reflected in traditional cost factors. Innovative approaches or new materials might not be accurately represented, leading to potential underestimation or overestimation of costs.
  6. Lack of Project-Specific Information: Cost factors are based on average conditions, and they may not take into account the specific conditions of a project site. Site-specific challenges, such as environmental conditions or logistical constraints, may not be adequately considered.
  7. Over-Reliance on Averages: Averaging costs across various projects do not capture outliers.  Relying solely on averages without considering the range of potential costs can lead to significant errors.

To mitigate these issues, it’s advisable limit the use of construction cost factors and rely upon detailed local data, expert judgment, and a thorough understanding of specific project requirements.


← Back

Thank you for your response. ✨

FAST and RELIABLE Cost Estimates

Finally, FAST and RELIABLE Cost Estimates for construction, renovation, repair, and maintenance are now possible with 4BT’s local market detailed cost data!

  • Objective
  • Current
  • Local Market
  • Detailed
  • CSI Masterformat
  • Preventive Maintnenace Cost Data (also available – organized using expanded UNIFORMAT)

Gain measurably improved cost visibility and cost management capability for your organization by using verifable data to build FAST and RELIABLE Cost Estimates.


Learn Why 4BT’s Data Structure Excels.

FAST and RELIABLE Cost Estimates

FAST and RELIABLE Cost Estimates
commerical cost

FAST and RELIABLE Cost Estimates FAST and RELIABLE Cost Estimates

Construction cost data must be valid, reliable, and verifiable  to objectively and realistically represent current local market conditions.

  1. Exclusive source of current, LOCAL MARKET commercial construction cost data
  2. Measurably improve Cost Visibility and Cost Management Capabilities
  3. Evaluate and validate contractor bids / proposals with verifiable cost data for materials, labor, and equipment
  4. Eliminate Guesswork: Remove reliance on error prone “market average cost data, location and economic adjustment factors.
  5. Support LEAN and Value Management Principles: Enable waste reduction, value generation, and continuous improvement by providing verifiable and actionable data.
  6. Adapt to Market Realities: Ensure projects are not derailed by unexpected cost changes.

Care should be given as to what form of cost data is being used. 

Objective, verifiable, and locally researched detailed line-item construction tasks, replete with labor, material, equipment and productivity information, provide the highest level of cost visibility and cost management capability.   4BT exclusively offers this information for any location, with all line-items organized using expanded CSI MasterFormat, enabling clear communication, collaboration, and alignment with all technical domains and participants throughout the planning, procurement, and project delivery lifecycle.

Other, less stringent forms of cost estimating include the following:

  • national average line-item cost data (with or without adjustment or localization factors),
  • system level cost data,
  • assembly level cost data,
  • building level,
  • and/or other forms of parametric cost data,
  • historical cost data and economic factoring,
  • contractor, subcontractor quotes.

[NOTE: UNIFORMAT is best used to express functional elements (assemblies) of a repair, renovation, maintnenance, or new build project).  It provides a consistent approach that describes associated components across different projects in cost and function.   UNIFORMAT primarily use is in early stages of a project where a specific work scope (scope of work/SOW) has not been fully defined and  critical characteristics of the projects  not yet been determined, or to denote “Assemblies” that are create from MasterFormat unit price book line items.   MasterFormat, accounts for  specific details of practical knowledge and terminology inclusive of means nd methods, and is primarilpy used at stages of a project where enough particulars and specific work scopes have been established, such as when a project is ready for procurement, or for the development of a reliable cost.]

Construction Cost Estimating Guide

The following is presented as a Construction Cost Estimating Guide for enabling owners and design-builders to gain visibility into actual local market labor, material, and equipment costs.

It has long been recognized that detailed line item estimating is a proven best practice for developing verifiable, objective, and actionable cost information for repair, renovation, maintenance, and new build projects.   The core element is establishing an objective, verifiable, and current database of granular construction tasks based upon appropriate construction means and methods.

Detailed Line-Item Estimates

  • Granular Task Descriptions:
    • Estimates should break down the work into detailed, granular tasks, including quantities and specific descriptions. 
  • Local Market Data:
    • Focus on using current, verifiable, and locally researched labor, material, and equipment costs. 
  • Unit Pricing:
    • Calculate costs per unit of measure (e.g., square foot, cubic foot, each) to facilitate accurate cost forecasting. 
  • Standardized Data Architecture:
    • Use a robust data architecture such as expanded CSI Masterformat.
Key Factors Impacting Estimates
  • Who, What, When, Where, How:
    Consider who will do the work, the work content (detailed specifications), the schedule, the location, and the methods of construction. 

  • Planning, Procurement, and Project Delivery:
    These processes significantly influence the final cost, so they should be factored into the estimation process. 

  • Team Knowledge and Productivity:
    Estimators need to understand the skills and capabilities of the people involved in the project, as productivity is directly linked to the team. 

    Construction Cost Estimating Guide
 Importance of Verifiability and Actionability
  • Forget “Accuracy”:
    There is no such thing as a truly “accurate” cost estimate, but rather a focus on creating defensible, verifiable, and detailed estimates.
  • Actionable Estimates:
    The estimate should be reliable and actionable, used to inform procurement and project delivery decisions.

    UNIFORMAT is best used to express functional elements (assemblies) of a repair, renovation, maintenance, or new build project.

    It provides a consistent approach that describes associated grouping of components across different projects by cost and function. It’s primarily use is in early stages of a project when a specific work scope (scope of work/SOW) has not been fully defined and critical characteristics of the projects not yet been determined.

    MasterFormat, accounts for specific details of practical knowledge and terminology inclusive of means and methods and is primarily used at stages of a project where enough particulars and specific work scopes have been established, such as when a project is ready for procurement, or for the development of a reliable cost.

    Procurement of any repair, renovation, maintenance, or new build should include appropriate detail and use objective, current, local market cost data.

    Significant professional skill is required to properly use Masterformat and the extensive list of numbers and tittles of materials and methods that are available. Estimators must be able to search for and select proper items.  The appropriate application and use of Masterformat, and subsequent creation of verifiable cost estimates is therefore somewhat limited to the availability of skilled estimators.

    The use of current, locally reserached, granular cost data, organized using expanded Masterformat, provides 40%+ greater cost visibility than UNIFORMAT or alternative methodologies.

    Integrated LEAN Construction Planning, Procurement, and Project Delivery for Owners and Design-Builders

    ← Back

    Thank you for your response. ✨

Principles of Verifiable Cost Estimating

The following Principles of Verifiable Cost Estimating can significantly improve both construction cost visibility and management.

Summary of key elements identified in each of the principles:

Integrity – A robust cost data management process shall be implemented to ensure objectivity, timeliness,  standardization, and that everyone is working with the same information. All information shall be updated regularly and based upon local market conditions and current construction means, methods, and standards, and supported by proven data management and verification strategies.

Collaborative Framework – A robust, comprehensive framework shall be applied for all repair, renovation, maintenance, and new construction activities. This framework shall be supported by a long-term multi-party agreement between real property owners and services providers and an associated written operations manual / execution guide. This framework shall support early and ongoing information sharing and decision-making among planning, procurement, and project delivery teams.

Granularity – Task shall be presented at the line-item level to ensure the appropriate communication and use of required labor, material, equipment, and quantities. Each task shall be assigned an appropriate data classification standard, such as expanded CSI Masterformat. Productivity information shall also be included as well as a unit of measure. Each task shall also have a description, communicated in in plain English using industry standard terminology.

reliable cost data
commerical cost

Principles of Verifiable Cost Estimating

Principles of Verifiable Cost Estimating
Objective, current, local market construction cost data


Learn more about how to apply Principles of Verifiable Cost Estimating …

← Back

Thank you for your response. ✨